

How to use the Positional Picks scanner?
This scanner lists stocks suitable for positional trading, i.e., trades lasting for weeks or months. It’s particularly effective in indicating when a stock is gaining short-term momentum, enabling traders to capture the move over a few weeks or months. We have used relative strength index (RSI) to define momentum in the stock.
Relative Strength Index
The Relative Strength Index (RSI) is a momentum oscillator traders use to measure the speed and change of price movements. It ranges from 0 to 100, with values above 70 indicating overbought conditions and below 30 indicating oversold conditions. The RSI helps identify potential buy or sell signals and trend reversals based on market momentum.
How does the scanner use RSI to shortlist stocks for positional trading?
It filters out stocks with a weekly RSI above 40 and 60 levels and a daily close greater than the daily open. When a company shows strong performance and growth in its sector, expanding its business and balance sheet, the stock’s RSI tends to sustain above 40. Such stocks often show promising returns when their weekly RSI surpasses 60. You can add these stocks to your watchlist and consider taking a position after the breakout from the consolidation, or use other indicators such as Supertrend, MACD, or moving average to find a suitable entry point.
To implement this strategy, we recommend using the following stock universe, indicators, and time frame:
- Stock Universe: Nifty 500
- Indicators: Relative Strength Index (RSI)
- Time Frame: Weekly
Example Trade
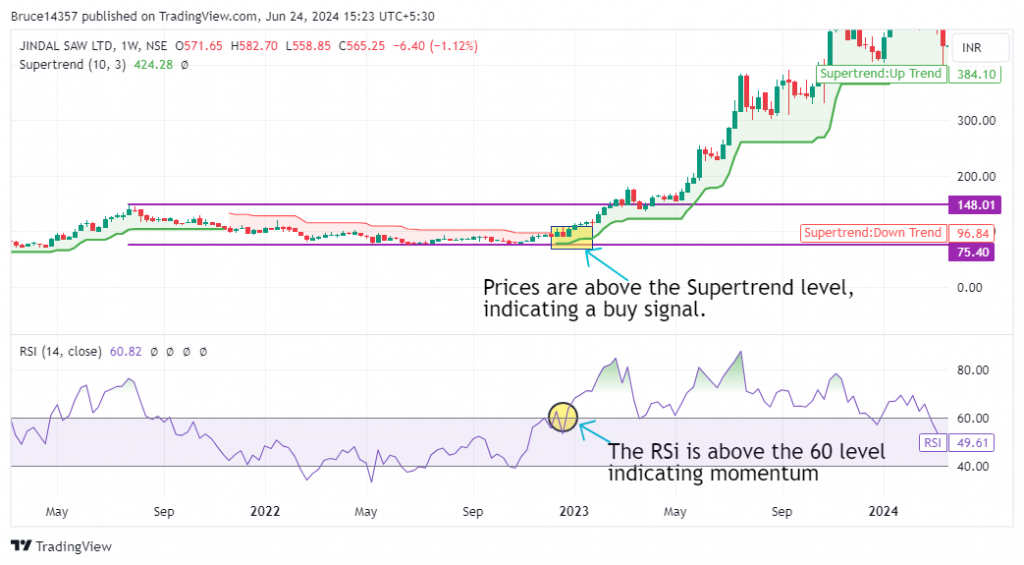
This strategy triggered an entry in Jindal Saw Ltd. on 12th Dec 2022 when the RSI was above the 60 level and the Supertrend indicator was also giving the buy signal.
Don’t forget
- This strategy is best suited to be used in the weekly time frames for stocks. To find an entry point, you can analyze the chart at a lower timeframe.
- Don’t use RSI in isolation, use other indicators, candlestick patterns, and breakouts to support your entry and exit level of the trade.
- It is wise not to depend solely on this strategy for your entire portfolio.
- Above-average trading volumes on the day of entry and exit serve as strong confirmation signals.
Learn Momentum Trading with these courses

Swing Trading for Beginners
by Harneet Singh Kharbanda

Basics of Momentum Trading
by Khagesh Agarwal

Momentum Swing Trading
by Himanshu Arora
Frequently Asked Questions
Shall I trade in all the stocks listed in this scanner?
No! This scanner is just a first-level filter to get a list of stocks that are showing good momentum based on the RSI indicator. Further analysis is recommended before initiating a trade.
How can I learn more about momentum trading?
You can learn momentum trading from experienced traders and highly rated instructors at Upsurge.club. We would highly recommend Himanshu Arora’s Momentum Swing Trading course on Upsurge.club, which will teach you a swing trading strategy especially for mid and small cap stocks.