
How to use the Stochastic RSI + Supertrend scanner?
This scanner filters out stocks for swing and positional trading on the following basis: when the daily close is greater than the Supertrend level and the daily slow stochastic %K (140,30) crosses above the daily slow stochastic %D (140,30), indicating potential upward momentum in the stock price.
Let’s learn about the indicators used in this scanner.
Supertrend indicator
This indicator identifies trends and potential reversal points. It is plotted on the price chart, giving out buy and sell signals based on price action and volatility. It determines trend direction, and entry & exit points, helping enhance a trading strategy’s accuracy and efficiency. We have used the default settings of the indicator in this scanner.
Stochastic RSI Indicator
This indicator combines the Stochastic Oscillator and Relative Strength Index (RSI) where the oscillator’s values are calculated using the RSI instead of the price of the stock. A stochastic oscillator helps in determining trends and predicting reversals. This oscillator is made up of two lines – the K%, which reflects the actual value of the oscillator, and the D%, which is a 3-day moving average of K%. When the slow stochastic K% crosses above D%, it indicates bullish momentum strengthening, potentially signaling a buy signal as it suggests the current price is rising faster than the average over recent periods. We have changed the settings of the indicator to RSI length-140, Stochastic Oscillator Length-140, K%-30, and D%-30. These changes produce a limited number of signals, but they tend to be accurate, leading to a high success rate.
This strategy is designed explicitly for swing and positional traders. It’s particularly effective in indicating when a stock is gaining short-term momentum, enabling traders to capture the move over a few weeks or months.
To implement this strategy, we recommend using the following stock universe, indicators, and time frame:
- Stock Universe: Market Cap > 1000 crores
- Indicators: Stochastic RSI and Supertrend
- Time Frame: Daily
Let’s learn how to enter & exit a trade with this strategy.
Entry
- Wait for the smoothened lines of the stochastic RSI to appear below 20.
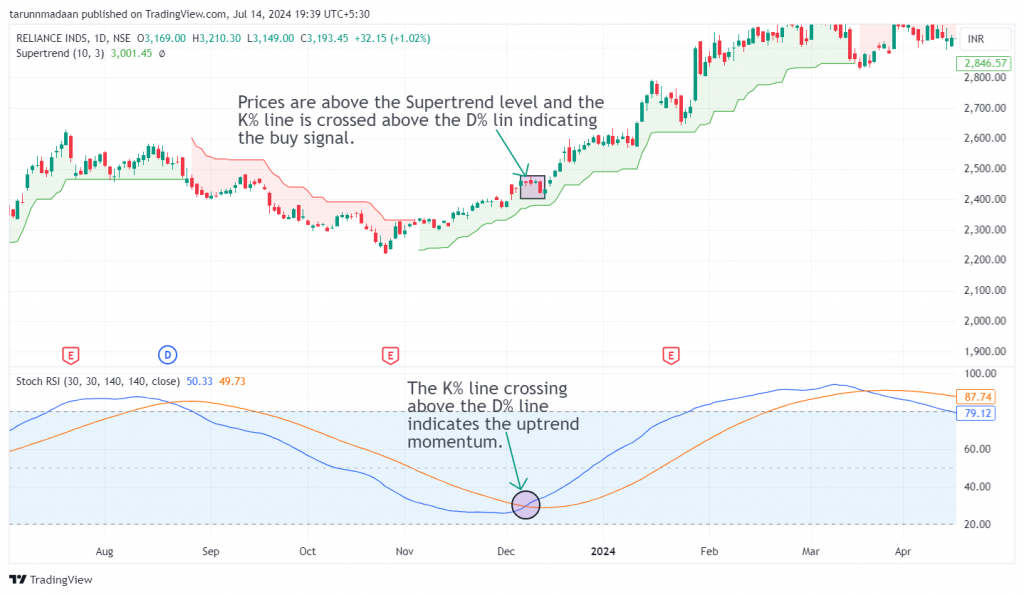
- An entry/long trade is triggered when the K% line crosses above the D% line.
- Make sure that the Supertrend is in the bullish zone, i.e. the Supertrend line is below the candles.
- The Supertrend line acts as a trailing stop loss for the trade.
The following chart marks the ideal entry points after the conditions of the strategy have been met:
Stop Loss
The price closing below the Supertrend level acts as a clear sign to exit the trade, signaling that the price is losing momentum.
Exit
You can exit the trade in either of the following instances:
- Wait for the smoothened lines of the stochastic RSI to appear above 80.
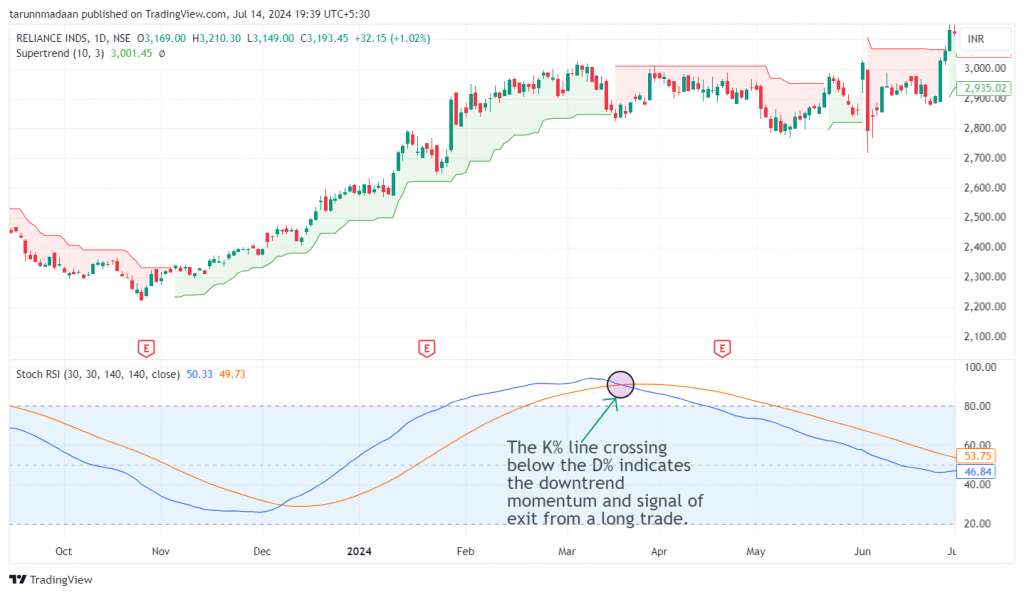
- An exit/short trade is triggered when the K% line crosses below the D% line.
- Make sure that the Supertrend is in the bearish zone, i.e. the Supertrend line is above the candles.
- The Supertrend line acts as a trailing stop loss for the trade.
The following chart marks multiple decent exit points as per the strategy:
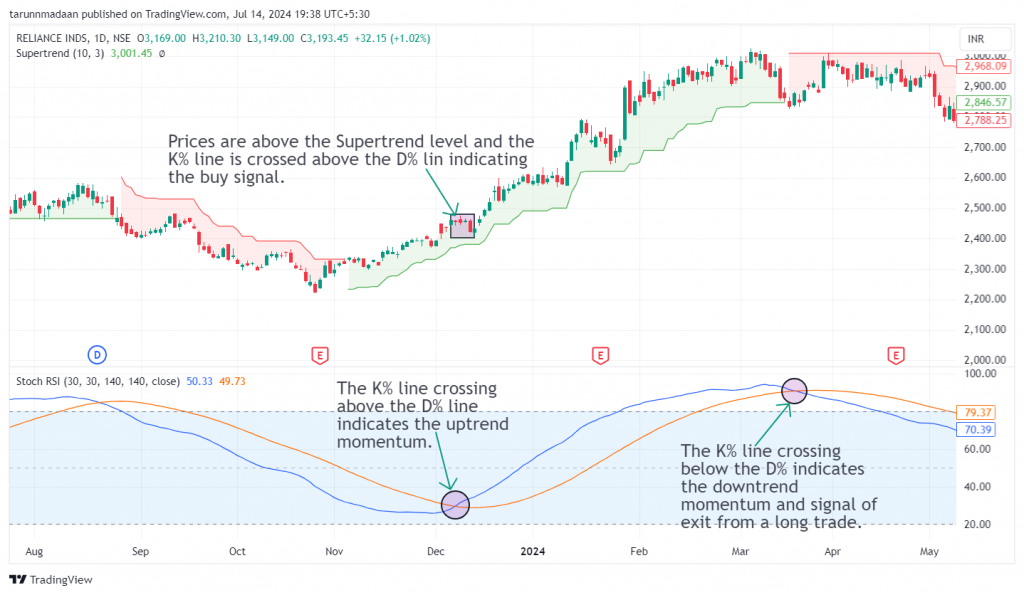
Example Trade
This strategy triggered an entry in Reliance Ltd. on 7th December 2023 when prices were above the Supertrend level and the K% line was crossed above the D% line, giving a buy signal. An exit was marked when the K% line crossed below the D% line on 18th March 2024. The trade lasted 102 days, yielding a return of 17.7%.
Don’t forget
- This strategy is best suited to be used in the daily time frame for most stocks. However, for some stocks, a weekly or monthly time frame may produce better results. Finding the optimal time frame involves a trial-and-error approach and necessitates thorough backtesting.
- It is wise not to depend solely on this strategy for your entire portfolio.
- Above-average trading volumes on the day of entry and exit serve as strong confirmation signals.
Learn to trade using RSI and Supertrend with these courses

Momentum Trading with RSI
by Bharat Jhunjhunwala

RSI Divergence Strategy
by Dinesh Nagpal

Supertrend Indicator Strategy
by Khagesh Agarwal
Frequently Asked Questions
Can this strategy be used on all time frames?
Yes, this strategy can be applied to various time frames, from intraday to long-term trading. However, the choice of time frame should align with your trading style and risk tolerance.
What are the risks associated with this strategy?
The risks include potential false signals during highly volatile or low-volume periods and reliance on indicator settings that may not suit all market conditions. It’s important to backtest and adjust the strategy parameters based on the asset and time frame.
How can I use futures and options with this trading strategy?
You can apply this strategy by buying futures contracts or selling put options when a bullish signal is indicated, or by purchasing stocks or call options to capitalize on the expected price increase.
How can I learn more about RSI and Supertend Indicators?
Upsurge.club offers a variety of courses on the RSI and Supertrend Indicator, covering topics from basic concepts to advanced strategies. You can explore these courses here.
.