
How to use the Triple Momentum Strategy scanner?
This scanner identifies stocks suitable for positional trading by using signals from the RSI, EMA, and ADX indicators.
Let’s learn about the indicators used in this scanner.
Exponential moving average (EMA)
It is a weighted average of the closing prices of the last few trading sessions, with a higher weight given to the most recent sessions. For example, a 30-day moving average shows the average price of the last 30 trading sessions, where the weight given to the most recent sessions would be more than the weight given to older sessions.
Relative Strength Index (RSI)
It is a momentum oscillator traders use to measure the speed and change of price movements. It ranges from 0 to 100, with values above 70 indicating overbought conditions and below 30 indicating oversold conditions. The RSI helps identify potential buy or sell signals and trend reversal based on market momentum.
Average Directional Index (ADX)
It measures trend strength in trading. It ranges from 0 to 100; values above 20 indicate a strong trend, while values below 20 suggest a weak trend or consolidation. ADX helps to identify the strength of a trend, aiding in decisions to enter, hold, or exit trades.
This strategy, a powerful combination of the RSI, EMA, and ADX indicators, is designed explicitly for swing traders. It’s particularly effective in indicating when a stock is gaining short-term momentum, enabling traders to capture the move over a few weeks.
To implement this strategy, we recommend using the following stock universe, indicators, and time frame:
- Stock Universe: Market Cap > 1000
- Indicators: Triple RSI, EMA, ADX
- Time Frame: Daily
Let’s learn how to enter & exit a trade with this strategy.
Entry
You can take a trade when all the below conditions are met:
1) The daily RSI for 5 and 10-day look-back periods crosses above the 21-day RSI and the 5-day RSI surpasses the 10-day RSI.
2) The daily closing price is greater than the 50-day EMA line.
3) ADX is above the 20 level.
For a more risk-averse approach, consider entering the stock only when the bullish candle surpasses the high of the previous candle.
Spotting a bullish candlestick pattern like a bullish marubozu or morning star provides strong confirmation for entering the trade.
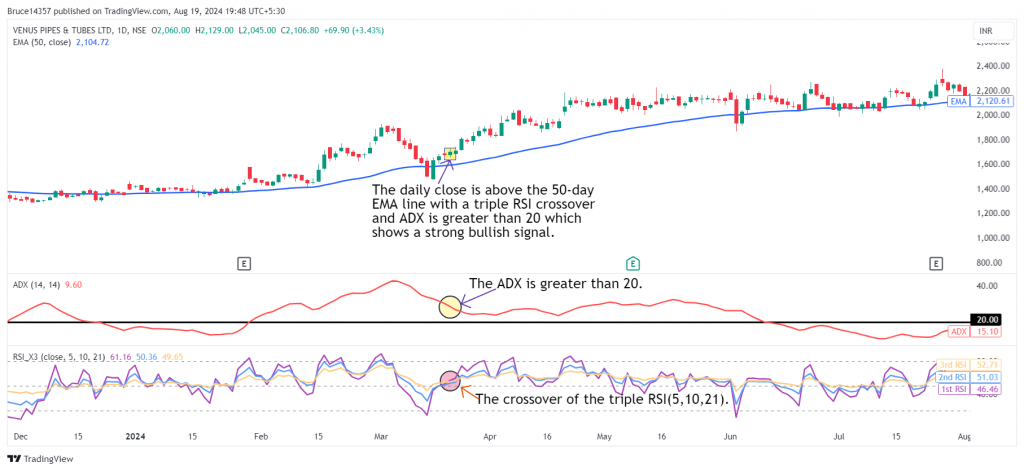
The following chart marks the ideal entry points after the conditions of the strategy have been met:
Stop Loss
The recent swing low acts as a clear sign to exit, indicating that short-term traders are losing momentum.
Exit
You can exit the trade in either of the following instances:
1) The daily candle closes below the 50-day EMA line.
2) ADX indicator goes below the 20 level.
3) The 5-day RSI line goes below the 10-day RSI line.
4) The 5-day RSI line goes above the 70 level.
Spotting a bearish candlestick pattern like a bearish marubozu, or evening star along with either of the above conditions provides strong confirmation for exiting the trade.
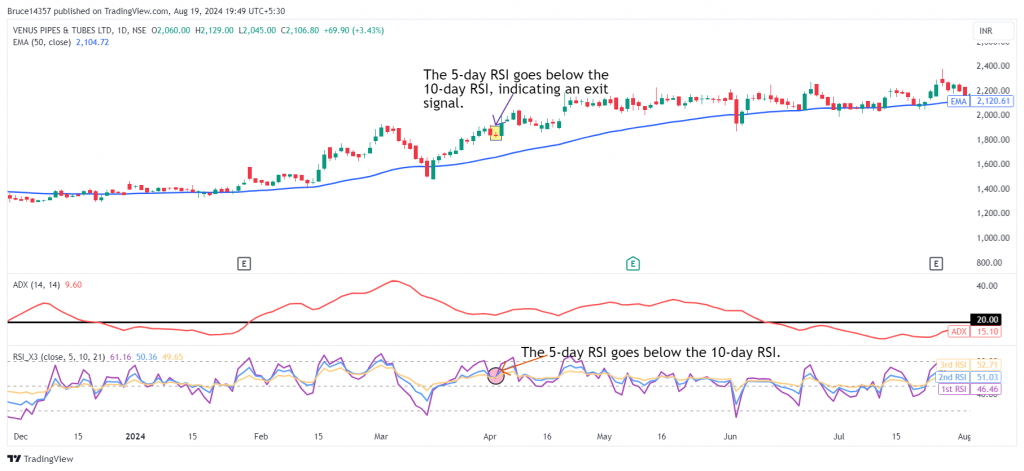
The following chart marks multiple decent exit points as per the strategy:
Example Trade
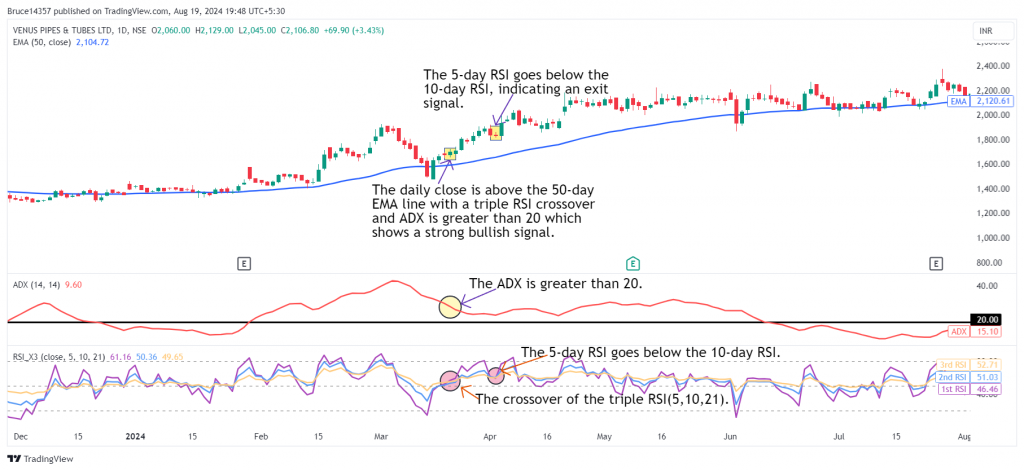
This strategy triggered an entry in Venus Pipes Ltd. on 19th March 2024 when prices were above the 50-day EMA line, ADX was greater than 20 and the crossover of the triple RSI(5,10,21), giving a buy signal. An exit was marked when the 5-day RSI went below the 10-day RSI on 2nd April 2024. The trade lasted 14 days, yielding a return of 7.7%.
Don’t forget
- This strategy is best suited to be used in the daily time frame for most stocks. However, for some stocks, a weekly or monthly time frame may produce better results. Finding the optimal time frame involves a trial-and-error approach and necessitates thorough backtesting.
- It is wise not to depend solely on this strategy for your entire portfolio.
- Above-average trading volumes on the day of entry and exit serve as strong confirmation signals.
Learn Positional Trading with these courses

Basics of Momentum Trading
by Khagesh Agarwal

Learn Technical Analysis in Hindi
by Jyoti Budhia

Momentum Trading with RSI
by Bharat Jhunjhunwala
Frequently Asked Questions
How do the RSI, EMA, and ADX indicators work together in this strategy?
The RSI measures momentum, the EMA tracks the average price with emphasis on recent sessions, and the ADX gauges trend strength. Together, they help identify strong, trending stocks that are gaining momentum, providing a clear signal for entry and exit points in positional trades.
What if the RSI, EMA, and ADX signals conflict with each other?
If the indicators provide conflicting signals, it’s advisable to avoid entering the trade. The strategy works best when all the indicators align, confirming the direction and strength of the trend.
How can I use futures and options with this trading strategy?
You can apply this strategy by buying futures contracts or selling put options when a bullish signal is indicated, or by purchasing stocks or call options to capitalize on the expected price increase.
How can I learn more about RSI, EMA and ADX Indicators?
Upsurge.club offers a variety of courses on the RSI, EMA and ADX Indicator, covering topics from basic concepts to advanced strategies. You can explore these courses here.
.