

How to use the Directional Momentum Strategy scanner?
This scanner identifies stocks entering a bullish phase based on key technical analysis principles and trend strength. It makes use of the EMA, ADX, and DMI indicators.
Let’s learn about the indicators used in this scanner.
Exponential moving average (EMA)
It is a weighted average of the closing prices of the last few trading sessions, with a higher weight given to the most recent sessions. For example, a 30-day moving average shows the average price of the last 30 trading sessions, where the weight given to the most recent sessions would be more than the weight given to older sessions.
Average Directional Index (ADX)
It measures trend strength in trading. It ranges from 0 to 100; values above 20 indicate a strong trend, while values below 20 suggest a weak trend or consolidation. ADX helps to identify the strength of a trend, aiding in decisions to enter, hold, or exit trades.
Directional Momentum Index (DMI)
It is a technical indicator that measures the strength and direction of a trend. It consists of two lines, the Positive Directional Indicator (+DI) and the Negative Directional Indicator (-DI), which track upward and downward movements, respectively. When +DI crosses above -DI, it signals a bullish trend; when -DI crosses above +DI, it indicates a bearish trend.
This strategy, a powerful combination of the EMA, DMI, and ADX indicators, is designed explicitly for swing traders. It’s particularly effective in indicating when a stock is gaining short-term momentum, enabling traders to capture the move over a few days or weeks.
To implement this strategy, we recommend using the following stock universe, indicators, and time frame:
- Stock Universe: Market cap > 1000
- Indicators: EMA, DMI
- Time Frame: Hourly
Let’s learn how to enter & exit a trade with this strategy.
Entry
You can take a trade when all the below conditions are met:
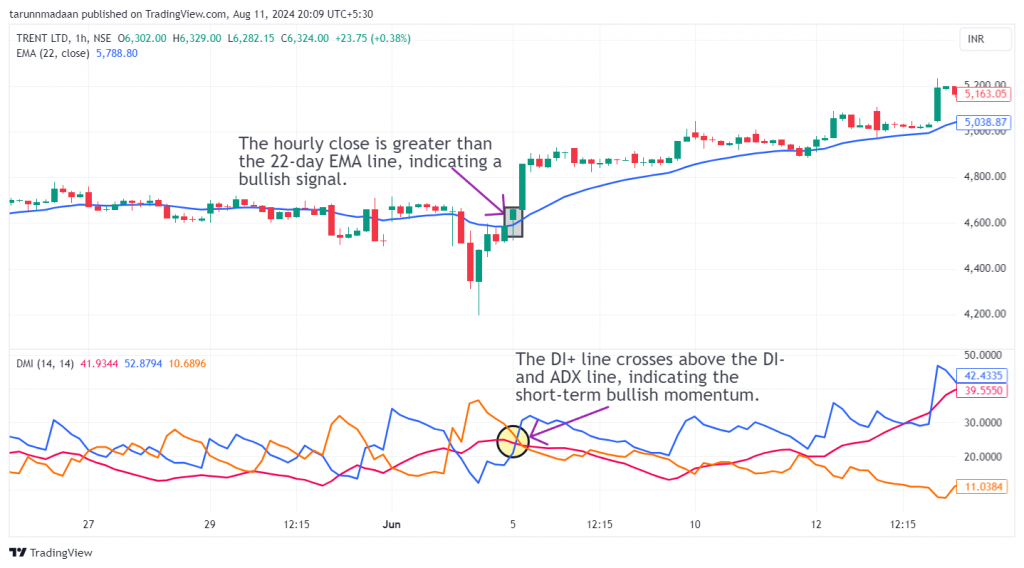
1) Hourly close is greater than the 22-day EMA line.
2) An entry/long trade is triggered when the DI+ line crosses above the DI- line.
3) Make sure that the DI+ crosses above the ADX line.
For a more risk-averse approach, consider entering the stock only when the bullish candle surpasses the high of the previous candle.
Spotting a bullish candlestick pattern like a bullish marubozu or morning star provides strong confirmation for entering the trade.
The following chart marks the ideal entry points after the conditions of the strategy have been met:
Stop Loss
The EMA line acts as a trailing stop loss for the trade. The hourly price closing below the 22-day EMA line acts as a clear sign to exit the trade, signaling that the price is losing momentum.
Exit
You can exit the trade in either of the following instances:
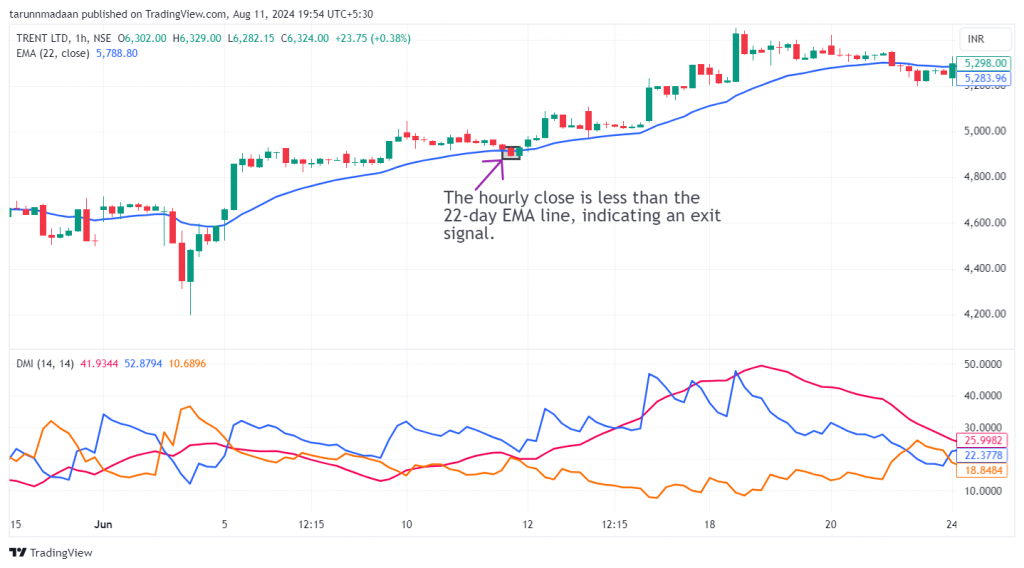
1) Hourly close is less than the 22-day EMA line.
2) An exit/short trade is triggered when the DI+ line crosses below the DI- line.
Spotting a bearish candlestick pattern like a bearish marubozu, or evening star along with either of the above conditions provides strong confirmation for exiting the trade.
The following chart marks multiple decent exit points as per the strategy:
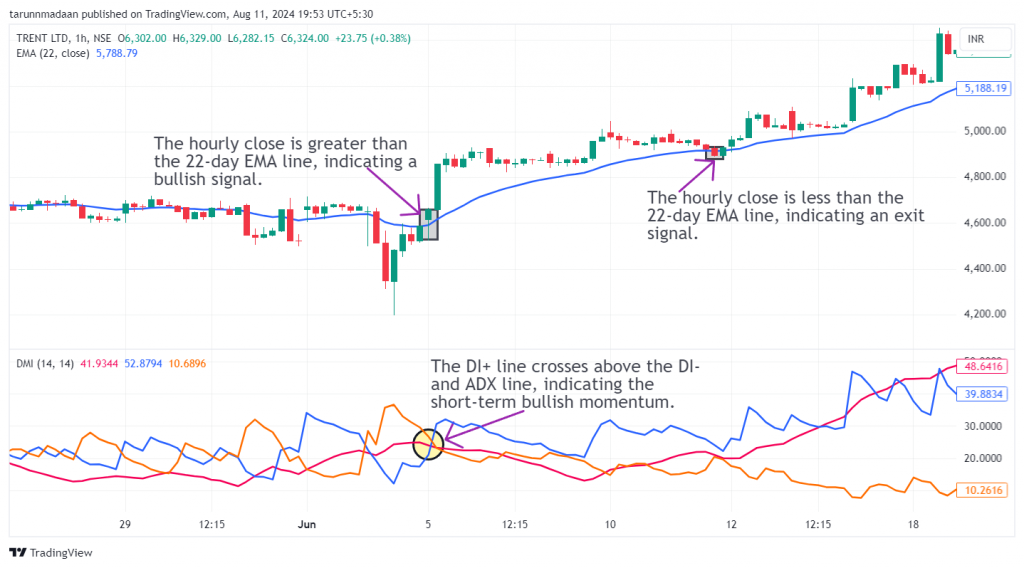
Example Trade
This strategy triggered an entry in Trent Ltd. on 5th June 2024 when the hourly close was above the 22-day EMA line and the DI+ line was crossed above the DI- & ADX line, giving a buy signal. An exit was marked when the hourly close was below the 22-day EMA line on 11th June 2024. The trade lasted 7 days, yielding a return of 5.15%.
Don’t forget
- This strategy is best suited to be used in the hourly time frame for most stocks. However, for some stocks, a daily or weekly time frame may produce better results. Finding the optimal time frame involves a trial-and-error approach and necessitates thorough backtesting.
- It is wise not to depend solely on this strategy for your entire portfolio.
- Above-average trading volumes on the day of entry and exit serve as strong confirmation signals.
Learn Swing and positional trading with these courses

Learn Technical Analysis in Hindi
by Jyoti Budhia

Swing Trading and Scalping Strategies
by Super Trader Lakshya

Momentum Swing Trading Strategy
by Himanshu Arora
Frequently Asked Questions
Is this strategy suitable for all market conditions?
This strategy is best suited for trending markets, particularly when the market shows clear directional movement. It may not be as effective in choppy or sideways markets where price action lacks clear momentum.
How important is volume in this strategy?
Although volume is not directly part of this strategy, high trading volume can reinforce the strength of the signals provided by the EMA, ADX, and DMI indicators, confirming the legitimacy of a trend.
What should I do if the signals are conflicting?
If the signals from EMA, ADX, and DMI are conflicting, it’s advisable to wait for clearer alignment before entering a trade. Conflicting signals often indicate market indecision, which can lead to false entries and exits.
How can I use futures and options with this trading strategy?
You can apply this strategy by buying futures contracts or selling put options when a bullish signal is indicated, or by purchasing stocks or call options to capitalize on the expected price increase.
How can I learn more about EMA and ADX Indicators?
Upsurge.club offers a variety of courses on the EMA andADX Indicator, covering topics from basic concepts to advanced strategies. You can explore these courses here.
.