
How to use the Volume Spike Stocks scanner?
Before we learn about this scanner, let’s understand the importance of volume in trading.
Importance of Trading Volume
Volume in trading refers to the total number of shares or contracts traded for a security during a given period. The volume is used to gauge the strength of a price movement; higher volume often indicates stronger, more reliable trends, while lower volume can suggest weaker trends or potential reversals. It helps in confirming price movements and market sentiment.
More often than not, a high trading volume is indicative of ‘smart money’ entering the stock, i.e., a fresh investment by domestic and foreign institutions.
A volume moving average is a useful add-on indicator too. The moving average of volume indicates the average trading volume over a specific period, smoothing out short-term fluctuations. It helps in identifying trends in trading activity, such as increasing or decreasing interest in a security. A rising volume moving average can signal growing market interest, while a declining average may signal waning interest or consolidation periods.
Understanding the Volume Spike Stocks scanner
This scanner lists stocks experiencing above-average volumes, indicating market momentum, both bullish and bearish. It filters out stocks when whose volumes are greater than 2 times their 10-day average and passing any of the below conditions:
- Current day’s daily close is more than 5% of the previous day’s close. (Bullish Signal)
- Current day’s daily close is less than 5% of the previous day’s close. (Bearish Signal)
We recommend using the following stock universe, indicators, and time frame for a volume based trading strategy:
- Stock Universe: Nifty 500
- Indicators: Relative Strength Index (RSI), Supertrend
- Time Frame: Daily
This scanner is especially useful for intraday trading, and stocks found on this scanner can be further evaluated for the same.
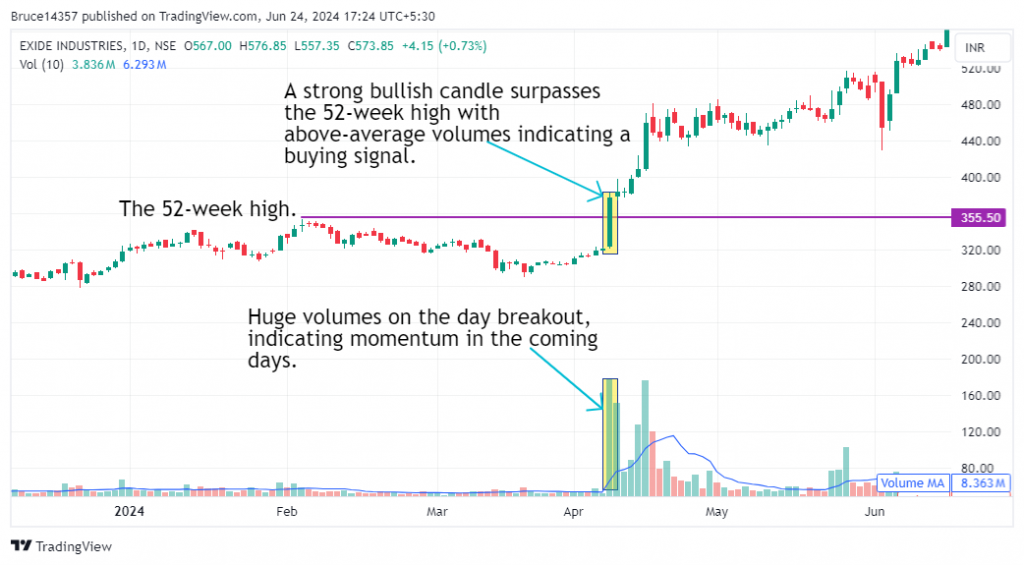
Example Trade
This strategy triggered an entry in Exide Industries Ltd. on 08th April 2024 when a strong bullish candle surpassed the all-time high of the stock with volumes greater than 2x of its simple moving average (volume), indicating strong short-term momentum.
Don’t forget
- This strategy is best suited to be used in the daily time frame for most stocks. However, for some stocks, a weekly time frame may produce better results. Finding the optimal time frame involves a trial-and-error approach and necessitates thorough backtesting.
- It is wise not to depend solely on this strategy for your entire portfolio.
- Using trendlines, support, resistance, and indicators along with this strategy will give you a better understanding of the trend.
Learn momentum trading with these courses

Technical Analysis in Hindi
by Jyoti Budhia

Basics of Momentum Trading
by Khagesh Agarwal

Intraday Trading Strategies
by Jyoti Budhia
Frequently Asked Questions
Can I use volume analysis for every strategy?
Yes, the volume indicator can enhance any trading strategy by confirming price trends, identifying reversals, and validating breakouts, helping traders make more informed decisions based on market activity.
Can I swing trade in the stocks listed in this scanner?
This scanner lists stocks that are trading at 2x their 10-day average volumes and have shown a significant move of more than 5% (bullish or bearish). Such stocks are excellent contestants for intraday trading. Their momentum may or may not last for more than a day. It is prudent to watch the stock for more trading sessions and look for other confirming signals before considering it for swing or positional trading strategies.
How can I learn more about intraday trading?
You can learn intraday trading from experienced traders and highly rated instructors at Upsurge.club. We would highly recommend Jyoti Budhia’s Intraday Trading Strategies course on Upsurge.club.