How to use the Darvas Box Breakout scanner?
This scanner identifies stocks suitable for swing trading, which involves trades lasting for days or a few weeks. The Darvas Box Theory was introduced by Nicolas Darvas, a professional dancer and author of the 1960 book “How I Made $2 Million in the Stock Market.” Darvas claimed to have made his extraordinary gains during the 1957-58 bull market. He used a simple form of technical analysis called “box theory” to identify stocks within a narrow trading range. This theory is a trading strategy that follows the momentum of stocks and simply states that stocks that have increased in the past are more likely to increase in the future.
The Darvas Box Theory scanner filters stock based on price breakout and volume. When the stock is above its 200-day EMA, breaks its narrow trading range and 52-week high with large volumes indicates that the stock is gaining short-term price momentum.
This strategy, a powerful combination of the price and volumes, is designed explicitly for swing traders. It’s particularly effective in indicating when a stock is gaining short-term momentum, enabling traders to capture the move over a few days or weeks.
To implement this strategy, we recommend using the following stock universe, indicators, and time frame:
- Stock Universe: Nifty 500
- Indicators: Volume, Exponential Moving Average(EMA)
- Time Frame: Daily
Let’s learn how to enter and exit a trade with this strategy.
Entry
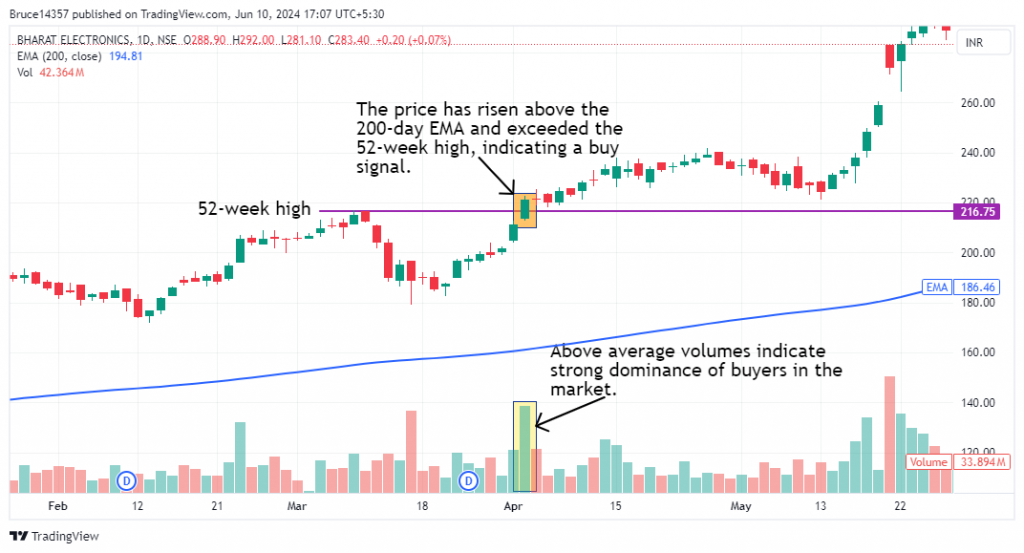
1. The scanner identifies stocks when the daily close is greater than the 200-day EMA breaks its narrow trading range and 52-week high with large volumes.
2. An entry is triggered once the above conditions confirm a buy signal.
3. Ideally, you should enter the stock at the end of the day, on the first bullish candle on the daily timeframe.
4. Spotting a base formation or bullish candlestick pattern like a bullish marubozu or morning star provides strong confirmation for entering the trade.
The following chart marks the ideal entry point after an as per the strategy’s conditions:

Stop Loss
The latest swing low will act as a stop loss, indicating the stock is losing short-term price momentum.
Exit
You can exit the trade in either of the following instances:
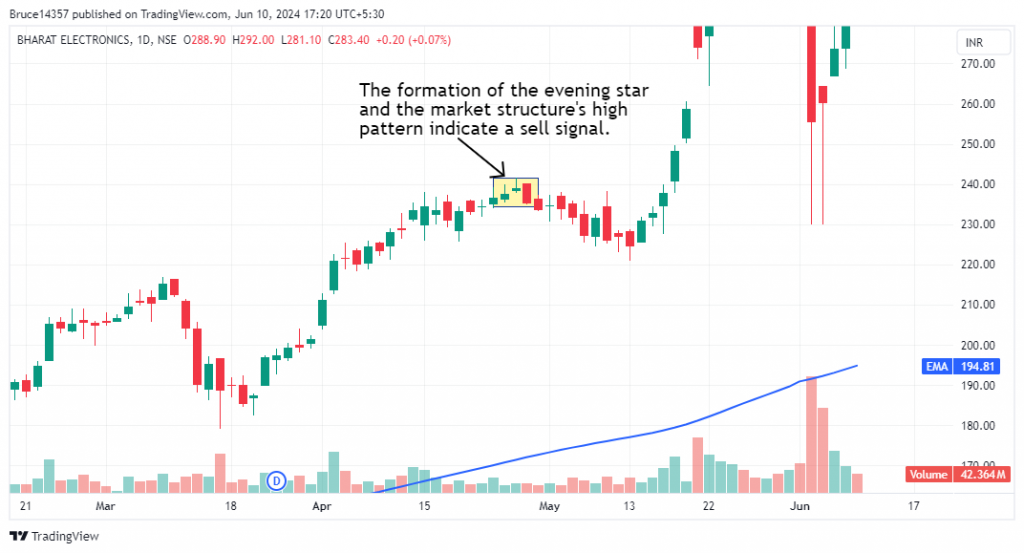
- Spotting a strong bearish candlestick pattern like a bearish marubozu, or evening star provides strong confirmation for exiting the trade.
- The price breaching the narrow trading range downside indicates a sell signal.
The following chart marks an ideal exit point as per the strategy:

Example Trade
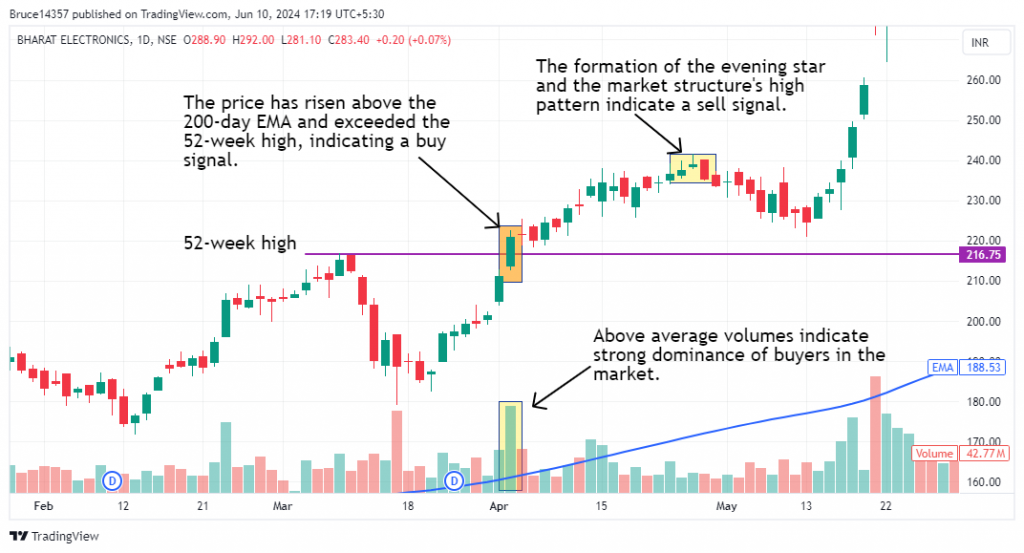
This strategy triggered an entry in Bharat Electronics Ltd. on 02nd April 2024 when a bullish candle surpassed the 52-week high with above-average volumes, the price is above the 200-day EMA, and an exit was triggered as the daily price formed the market structure high and the evening star pattern on 29th April 2024. The trade lasted 27 days, yielding a return of 6.5%.

Don’t forget
- This strategy is best suited to be used in the daily time frame for most stocks. However, for some stocks, a weekly or monthly time frame may produce better results. Finding the optimal time frame involves a trial-and-error approach and necessitates thorough backtesting.
- It is wise not to depend solely on this strategy for your entire portfolio.
- Above-average trading volumes on the day of entry and exit serve as strong confirmation signals.
Learn Momentum Trading with these courses

Swing Trading for Beginners
by Harneet Singh Kharbanda

Basics of Momentum Trading
by Khagesh Agarwal

Momentum Swing Trading
by Himanshu Arora
Frequently Asked Questions
Shall I trade in all the stocks listed in this scanner?
No! This scanner is just a first-level filter to get a list of stocks that are giving a 52-week breakout. Further analysis is recommended before initiating a trade, since it’s possible that many of them would be near their previous swing high or resistance level.
How can I learn more about momentum trading?
You can learn momentum trading from experienced traders and highly rated instructors at Upsurge.club. We would highly recommend Himanshu Arora’s Momentum Swing Trading course on Upsurge.club, which will teach you a swing trading strategy especially for mid and small cap stocks.
