
How to use the Death Crossover scanner?
This scanner lists stocks that are entering an effective bearish phase according to the principles of technical analysis. It filters out stocks that have shown bearish momentum in recent periods relative to their longer-term average, i.e., stocks whose 50-day EMA has crossed below their 200-day EMA.
An exponential moving average (EMA), is a weighted average of the closing prices of the last few trading sessions, with a higher weight given to the most recent sessions. For example, a 30-day moving average shows the average price of the last 30 trading sessions, where the weight given to the most recent sessions would be more than the weight given to older sessions. An EMA is useful in identifying the trend.
A bearish EMA crossover occurs when the shorter-term moving average crosses below its longer-term moving average. It is indicative of the short-term price momentum in the stock being lesser than the longer-term price momentum in the stock. A death crossover occurs when a stock’s 50-day EMA crosses below its 200-day EMA, and presents a good opportunity to participate in the new downtrend.
We recommend using the following stock universe, indicators, and time frame for this strategy:
- Stock Universe: Market cap > 1000
- Indicators: Exponential Moving Average (EMA)
- Time Frame: Daily
Let’s learn how to enter and exit a trade with this strategy.
Entry
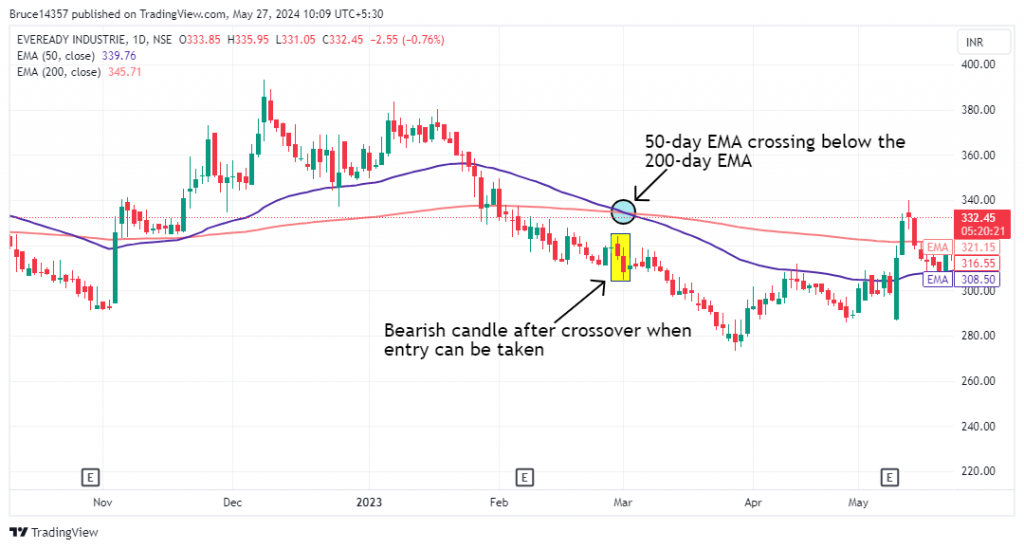
1. The scanner identifies stocks where the 50-day EMA has crossed below the 200-day EMA.
2. Enter the stock once this crossover is confirmed, specifically at the candle following the 50-day EMA crossing below the 200-day EMA.
3. Ideally, you should enter the stock at the end of the day, on the first bearish candle after the crossover.
4. For a more risk-averse approach, consider entering the stock only when a bearish candle surpasses the low of the candle that trigerred the entry.
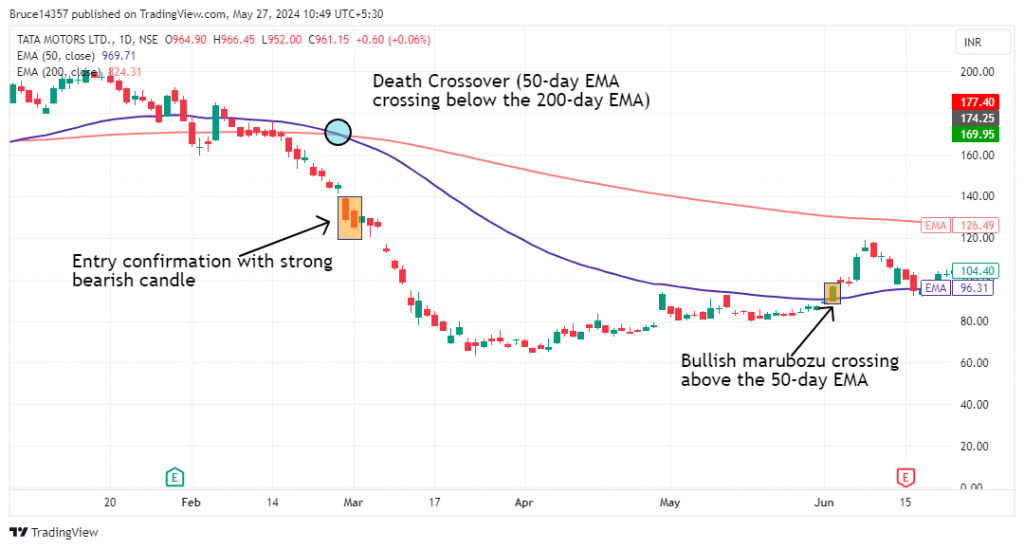
5. Spotting a bearish candlestick pattern like a bearish marubozu or evening star provides strong confirmation for entering the trade.
The following chart marks the ideal entry point after a death crossover occurs:
Stop Loss
The 50-day EMA acts as a stop loss for this trade. If the price goes above the 50-day EMA, it is a clear sign to exit, indicating that short-term traders are gaining momentum.
Exit
You can exit the trade in either of the following instances:
- The price reaches its latest swing low or previously tested support level.
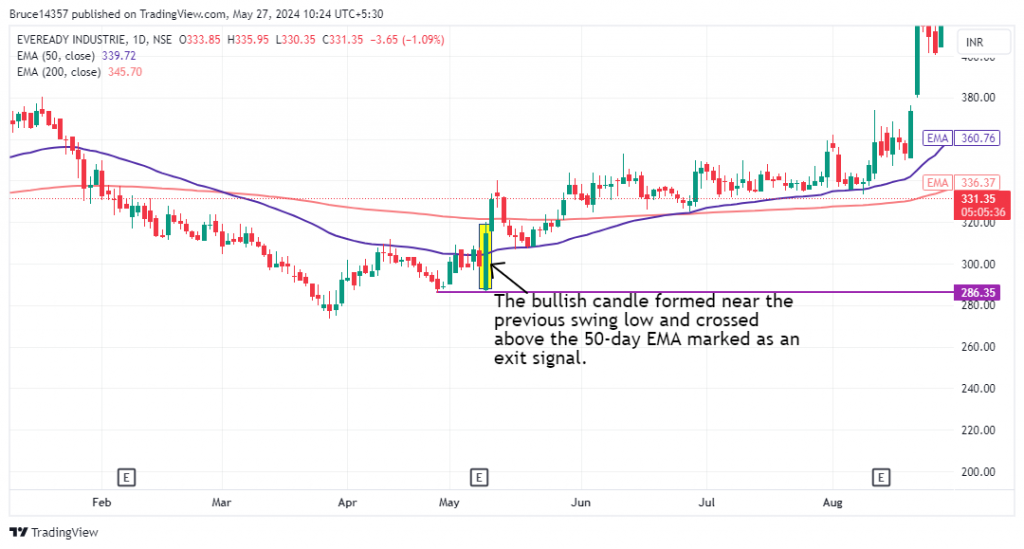
- The price closes above its 50-day EMA with a distinct bullish candle.
- Spotting a bullish candlestick pattern like a bullish marubozu, or morning star along with either of the above conditions provides strong confirmation for exiting the trade.
The following chart marks a good exit point after a death crossover:
Example Trade
This strategy triggered an entry in Tata Motors on 28th Feb, 2023 when the death crossover occurred, and an exit was marked by a bullish marubozu that crossed above the 50-day EMA on 02nd June 2024. The stock price fell 25% in 95 days.
Don’t forget
- This strategy is best suited to be used in the daily time frame for most stocks. However, for some stocks, a weekly or monthly time frame may produce better results. Finding the optimal time frame involves a trial-and-error approach and necessitates thorough backtesting.
- It is wise not to depend solely on this strategy for your entire portfolio.
- Above-average trading volumes on the day of entry and exit serve as strong confirmation signals.
Learn to momentum trading with these courses

Swing Trading Strategy
by Atul Patel

Momentum Swing Trading
by Himanshu Arora

Learn Swing Trading
by Abhay Patil
Frequently Asked Questions
Can this strategy be used on smaller time frames?
Yes, this strategy can be used on smaller time frames like 4-hour and 2-hour charts. However, note that the higher the time frame, the more accurate the signal. Smaller time frames may give you more number of signals but less winning trades.
Where can I learn momentum trading?
| To learn more about momentum trading, explore the following courses on Upsurge: |
| Momentum trading in options |
| Basics of momentum trading |
| Momentum swing trading strategy |