
How to use the Ichimoku Momentum Signal scanner?
This strategy aims to identify potential buy signals in stocks listed in the Nifty 500 segment by combining the Ichimoku Cloud indicators, RSI, and volume filters. It focuses on confirming a strong bullish trend and sufficient market participation.
Let’s learn about the indicators used in this scanner.
Ichimoku Cloud
It is a versatile indicator that defines support and resistance, identifies trend direction, gauges momentum, and provides trading signals. It consists of five lines: the Conversion Line, Base Line, Leading Span A, Leading Span B, and the Chikou Span (Lagging Span). The cloud formed between Span A and B highlights potential price action zones and trend strength. This indicator helps ini identifying trends, potential reversals, and market equilibrium.
Relative Strength Index (RSI)
It is a momentum oscillator traders use to measure the speed and change of price movements. It ranges from 0 to 100, with values above 70 indicating overbought conditions and below 30 indicating oversold conditions. The RSI helps identify potential buy or sell signals and trend reversal based on market momentum.
Volume
It refers to the total number of shares or contracts traded for a security during a given period. The volume is used to gauge the strength of a price movement; higher volume often indicates stronger, more reliable trends, while lower volume can suggest weaker trends or potential reversals. It helps in confirming price movements and market sentiment.
This strategy is designed explicitly for swing and positional traders. It’s particularly effective in indicating when a stock is gaining short-term momentum, enabling traders to capture the move over a few weeks or months.
To implement this strategy, we recommend using the following stock universe, indicators, and time frame:
- Stock Universe: Nifty 500
- Indicators: Ichimoku Cloud, Volume & RSI
- Time Frame: Daily
Let’s learn how to enter & exit a trade with this strategy.
Entry
You can take a trade when all the below conditions are met:
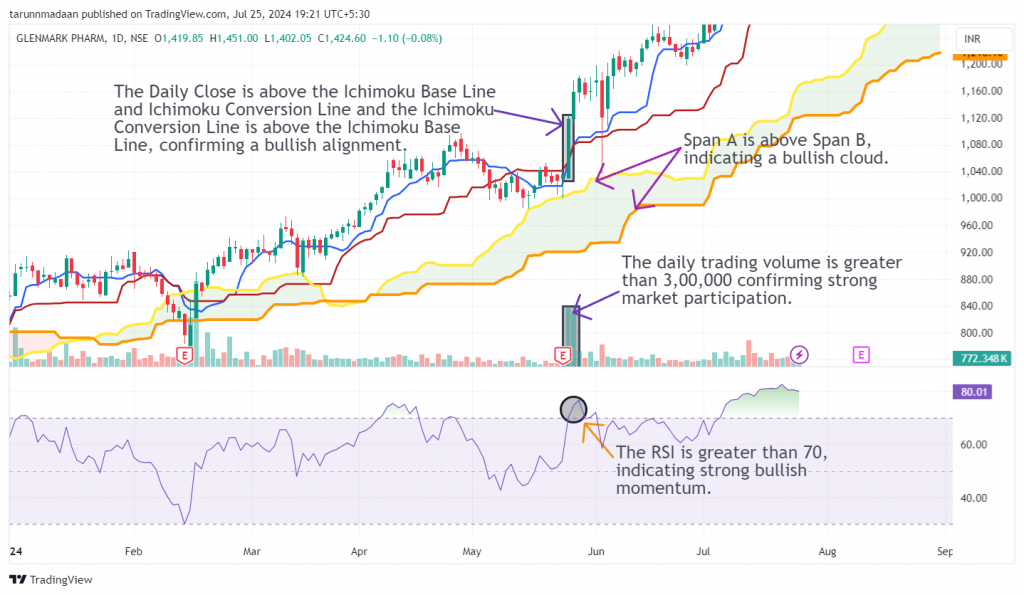
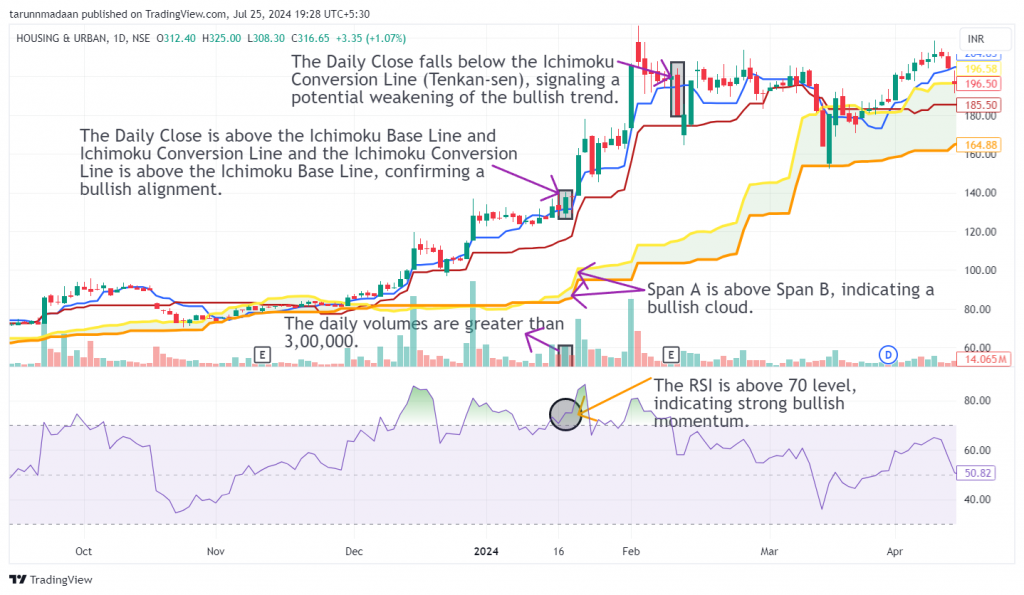
1.) The Daily Close is above the Ichimoku Base Line and Ichimoku Conversion Line.
2.) The Ichimoku Conversion Line should be above the Ichimoku Base Line.
3.) Span A must be above Span B, indicating a bullish cloud.
4.) The RSI (14) should be greater than 70.
5.) The daily trading volume is greater than or equal to 3,00,000.
6.)The daily open price should be greater than 51.
For a more risk-averse approach, consider entering the stock only when the bullish candle surpasses the high of the previous candle.
Spotting a bullish candlestick pattern like a bullish marubozu or morning star provides strong confirmation for entering the trade.
The following chart marks the ideal entry points after the conditions of the strategy have been met:
Stop Loss
The price closing below the Ichimoku Base Line acts as a clear sign to exit the trade, signaling that the price is losing momentum.
Exit
You can exit the trade in either of the following instances:
1.) Consider exiting the trade when the RSI rises above 80.
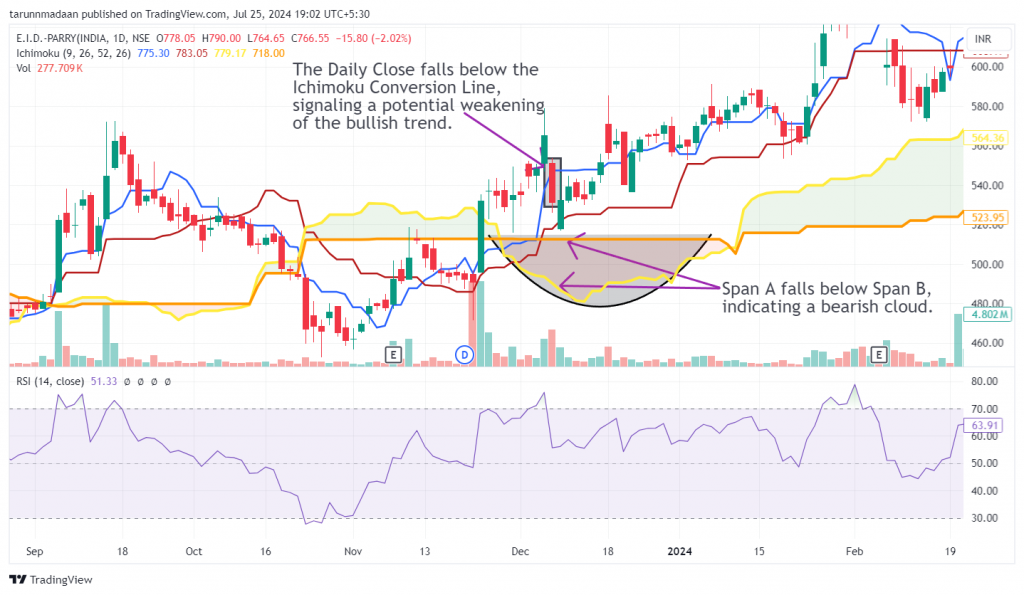
2.) Exit the trade if the Daily Close falls below the Ichimoku Conversion Line.
3.) A strong exit signal occurs if Span A falls below Span B.
4.) The Ichimoku Base Line or recent support level acts as a trailing stop loss for the trade.
Spotting a bearish candlestick pattern like a bearish marubozu, or evening star along with either of the above conditions provides strong confirmation for exiting the trade.
The following chart marks multiple decent exit points as per the strategy:
Example Trade
This strategy triggered an entry in HUDCO Ltd. on 17th January 2024 when all the conditions of the strategy were fulfilled. An exit was marked when the daily close fell below the Ichimoku Conversion Line on 12th February 2024. The trade lasted 26 days, yielding a return of 30.4%.
Don’t forget
- This strategy is best suited to be used in the daily time frame for most stocks. However, for some stocks, a weekly or monthly time frame may produce better results. Finding the optimal time frame involves a trial-and-error approach and necessitates thorough backtesting.
- It is wise not to depend solely on this strategy for your entire portfolio.
- Executing trades at the end of the trading session helps reduce the risk of false signals.
Learn scalping with these courses

Intraday Trading Strategies
by Jyoti Budhia

Options Scalping Strategies
by Himanshu Arora

Scalping in Futures
by Mukta Dhamankar
Frequently Asked Questions
What is the role of the Base Line in the Ichimoku Cloud strategy?
The Base Line serves as a major support or resistance level and acts as a trend indicator. It helps in identifying the overall direction of the market and is used to gauge potential entry or exit points.
How does the Conversion Line differ from the Base Line?
The Conversion Line is a shorter-term indicator compared to the Base Line. It reacts more quickly to price changes, making it useful for identifying short-term trends and potential reversals within the broader trend.
What do Span A and Span B represent in the Ichimoku Cloud?
Span A and Span B are boundaries of the Ichimoku Cloud, also known as the Kumo. The area between Span A and Span B provides insight into support and resistance levels. A price above the Kumo suggests a bullish trend, while a price below indicates a bearish trend. The thickness of the Kumo also reflects market volatility.
What should I do if one of the conditions is not met?
If one of the conditions is not met, it is advisable to wait until all conditions are satisfied before entering a trade. This ensures that you are following the strategy’s criteria strictly and increases the likelihood of a successful trade.
How can I use futures and options with this trading strategy?
You can apply this strategy by buying futures contracts or selling put options when a bullish signal is indicated, or by purchasing stocks or call options to capitalize on the expected price increase.
How can I learn more about RSI and Ichimoku Cloud Indicators?
Upsurge.club offers a variety of courses on the RSI and Ichimoku Cloud Indicator, covering topics from basic concepts to advanced strategies. You can explore these courses here.
.