How to use the Bearish Large Caps scanner?
This scanner lists stocks that are entering an effective bear phase according to the principles of technical analysis. Let’s learn a little about the filters and indicators used.
Heikin-Ashi Candles
We have used Heikin Ashi (HA) candles in this strategy because they provide clearer trend identification, reduced false signals, and easier visual analysis of market direction and strength which helps the trader in making better-informed decisions.
Supertrend indicator
It is a trading tool to identify trends and potential reversal points in financial markets. It plots on the price chart, signaling buy or sell opportunities based on price action and volatility. It determines trend direction, entry & exit points, and enhances the trading strategies’ accuracy and efficiency.
Exponential moving average (EMA)
This is a weighted average of the closing prices of the last few trading sessions, with a higher weight given to the most recent sessions. For example, a 30-day moving average shows the average price of the last 30 trading sessions, where the weight given to the most recent sessions would be more than the weight given to older sessions.
This scanner filters out stocks where the 2-hour closing price is below the Supertrend or is within 5% of it, the 20-day EMA is less than the 50-day & 200-day EMA, and the 50-day EMA is less than 200-day EMA.
We recommend using the following stock universe, indicators, and time frame for this strategy:
- Stock Universe: Nifty 100
- Indicators: Supertrend, Exponential Moving Average (EMA)
- Time Frame: 2-hour
Let’s learn how to enter and exit a trade with this strategy.
Entry
- The 20-day EMA should be less than 50-day & 200-day EMA and the 50-day EMA less than the 200-day EMA.
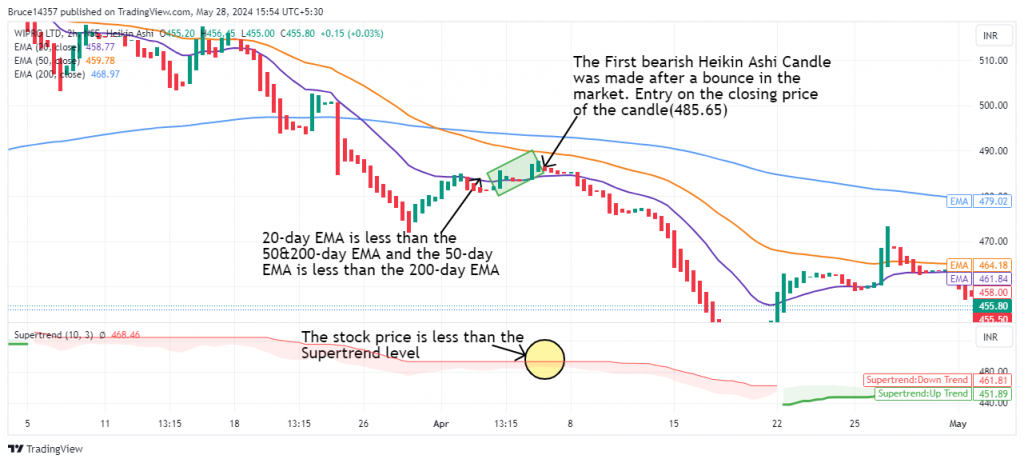
- Identify the point where the Heikin Ashi (HA) bearish candle was formed after the bounce in the market.
- If the above conditions are fulfilled then you can take entry when prices are within the 5% range of Supertrend only if you are an aggressive trader. Conservative traders can take trades only when the stock price is below the Supertrend level.
- Spotting a bearish candlestick pattern like a bearish marubozu or evening star provides strong confirmation for entering the trade.
The following chart marks the ideal entry point after an RSI + Supertrend signal occurs:
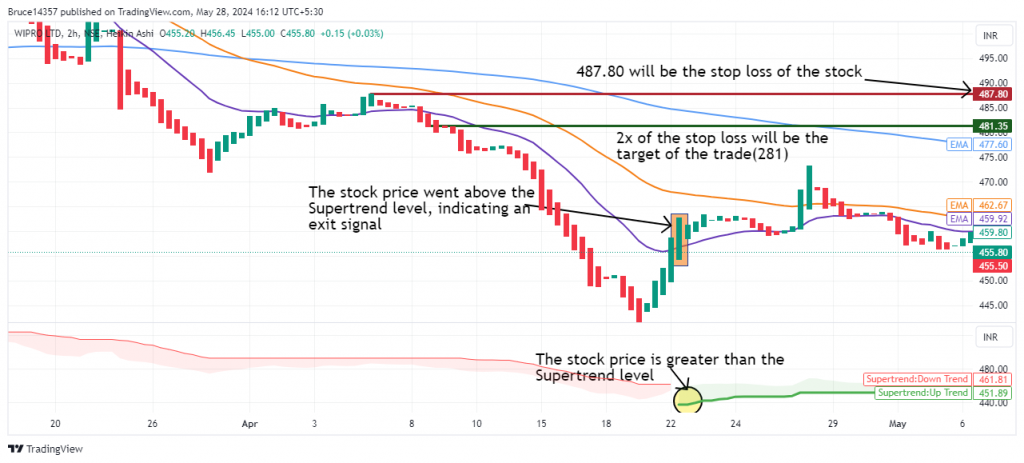
Stop Loss
The stock price closing above the Supertrend level or nearby swing high acts as a clear sign to exit, indicating that short-term traders are gaining momentum.
Exit
You can exit the trade in either of the following instances:
- You can exit your trade once you made 1.5 or 2x of your stop loss.
- The closing price crosses the Supertrend level.
- Spotting a bullish candlestick pattern like a bullish marubozu or a morning star near the previously tested support, or at the low of the chart confirms exiting the trade.
The following chart marks the multiple ideal exit points after a the ideal conditions occurs:
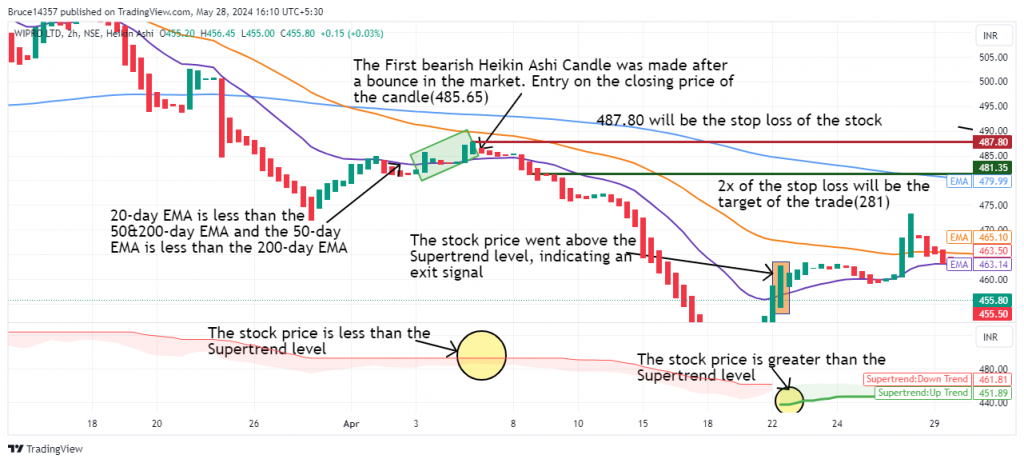
Example Trade
This strategy triggered an entry in Wipro Ltd. on 05th April 2024 when the 20-day EMA was less than 50&200-day EMA, the 50-day EMA was less than the 200-day EMA, a bearish Heikin Ashi candle was formed after a bounce in the market and the stock price is below the Supertrend level giving a buy signal, and the target of the trade was fulfilled on 22nd April 2024. The trade lasted 18 days, yielding a return of 5.3%.
Don’t forget
- This strategy is best suited to be used in the 2-hour time frame for most stocks. However, for some stocks, a 1-hour, 3-hour, or daily time frame may produce better results. Finding the optimal time frame involves a trial-and-error approach and necessitates thorough backtesting.
- It is wise not to depend solely on this strategy for your entire portfolio.
- Based on your trading style, you can select your EMAs in a 1:3:9 ratio and round off these EMA numbers to the nearest commonly used values.
- By using this strategy you can trade in the F&O segment of the underlying stocks.
- Above-average trading volumes on the day of entry and exit serve as strong confirmation signals.
Learn Swing Trading Strategies with these courses

Momentum Swing Trading Strategy
by Himanshu Arora

Swing Trading Strategy for Beginners
by Harneet Singh Kharbanda

Swing Trading With Trader's Paradise
by Abhay Patil
Frequently Asked Questions
Should I short sell all the stocks that come in the scanner?
No, this scanner is a first-level filter to help you create a watchlist for large-cap bearish stocks. You need to analyze these stocks further to determine if they are tradable and to determine the correct entry, exit, and stop-loss points.
How long should I hold the trade?
Ideally, you should be in the trade until either the stop loss, or target has not been breached, which can be signified by a strong bullish candlestick pattern or the price closing above the Supertrend.
Where can I learn more about this strategy?
You can learn more about this strategy in Mr. Himanshu Arora’s Momentum Swing Trading Strategy course.