
How to use the Large-cap Bullish scanner?
This scanner lists stocks that are entering an effective bull phase according to the Supertrend and EMA indicators. We have used Heikin Ashi (HA) candles in this strategy because they give a clearer trend identification, reduced false signals, and easier visual analysis of market direction and strength.
Let’s learn about the indicators used in this scanner.
Exponential moving average (EMA)
It is a weighted average of the closing prices of the last few trading sessions, with a higher weight given to the most recent sessions. For example, a 30-day moving average shows the average price of the last 30 trading sessions, where the weight given to the most recent sessions would be more than the weight given to older sessions.
Supertrend
It is a trading tool to identify trends and potential reversal points in financial markets. It plots on the price chart, signaling to buy or sell opportunities based on price action and volatility. It determines trend direction, entry & exit points, and enhances the trading strategies’ accuracy and efficiency.
Heikin Ashi candlesticks
These are the variations of traditional candlesticks used in technical analysis to smooth out price data and identify trends more clearly. Unlike standard candlesticks, which use open, high, low, and close prices, Heikin Ashi candlesticks calculate values differently, incorporating the previous bar’s data. This method reduces noise, making trends easier to spot and helping traders make better-informed decisions.
This strategy is suitable for swing traders because the stock is gaining short-term momentum which helps the traders to capture the move within a shorter period.
To implement this strategy, we recommend using the following stock universe, indicators, and time frame:
- Stock Universe: Nifty 100
- Indicators: Supertrend, Exponential Moving Average(EMA)
- Time Frame: 2-hour
Let’s learn how to enter & exit a trade with this strategy.
Entry
You can take a trade when all the below conditions are met:
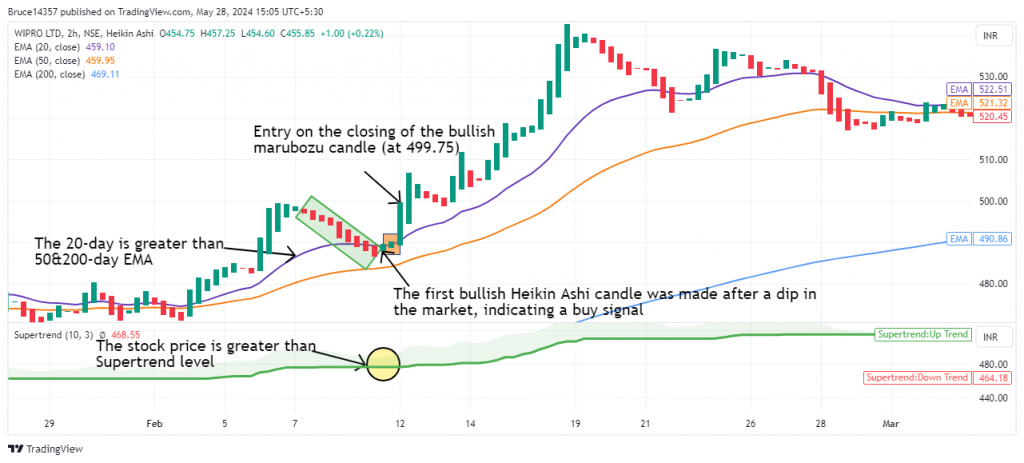
1) The 20-period EMA should be greater than 50 & 200-period EMA.
2) Identify the point where the Heikin Ashi (HA) bullish candle was formed after the dip in the market and took support near one of the EMA’s.
3) If the above conditions are fulfilled then you can take entry when prices are within the 5% range of Supertrend, only if you are an aggressive trader. Conservative traders can take trades when the stock price exceeds the Supertrend level.
For a more risk-averse approach, consider entering the stock only when the bullish candle surpasses the high of the previous candle.
Spotting a bullish candlestick pattern like a bullish marubozu or morning star provides strong confirmation for entering the trade.
The following chart marks the ideal entry points after the conditions of the strategy have been met:
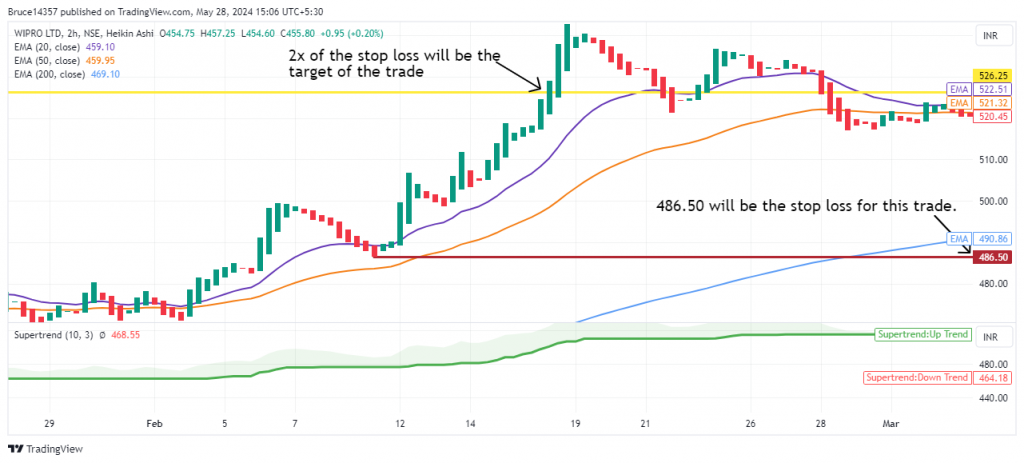
Stop Loss
The stock price close below the Supertrend level or nearby swing low acts as a clear sign to exit, indicating that short-term traders are losing momentum.
Exit
You can exit the trade in either of the following instances:
1) Exit the trade once you made 1.5 or 2x of your stop loss.
2) The price closes below the Supertrend level.
Spotting a bearish candlestick pattern like a bearish marubozu, or evening star along with either of the above conditions provides strong confirmation for exiting the trade.
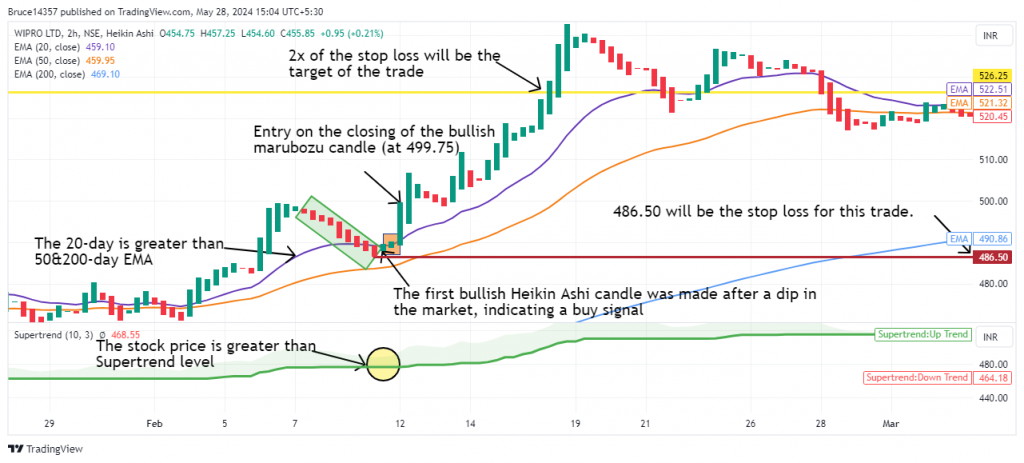
The following chart marks the ideal exit points for this strategy:
Example Trade
This strategy triggered an entry in Wipro Ltd. on 12th February 2024 when the 20-day EMA was greater than 50&200-day EMA, the 50-day EMA was greater than the 200-day EMA, a bullish Heikin Ashi candle was formed after a dip in the market and the stock price is above the Supertrend level giving a buy signal, and the target of the trade was fulfilled on 16th February 2024. The trade lasted 4 days, yielding a return of 5.3%.
Don’t forget
- This strategy is best suited to be used in the 2-hour time frame for most stocks. However, for some stocks, a 1-hour, 3-hour, or daily time frame may produce better results. Finding the optimal time frame involves a trial-and-error approach and necessitates thorough backtesting.
- Based on your trading style, you can select your EMAs in a 1:3:9 ratio and round these EMA numbers to the nearest commonly used values.
- It is wise not to depend solely on this strategy for your entire portfolio.
- Above-average trading volumes on the day of entry and exit serve as strong confirmation signals.
Learn Swing trading with these courses

Learn Technical Analysis in Hindi
by Jyoti Budhia

Swing Trading and Scalping Strategies
by Super Trader Lakshya

Momentum Swing Trading Strategy
by Himanshu Arora
Frequently Asked Questions
Is this strategy suitable for all market conditions?
This strategy is best suited for trending markets, particularly when the market shows clear directional movement. It may not be as effective in choppy or sideways markets where price action lacks clear momentum.
How does the Heikin Ashi candle help in this strategy?
Heikin Ashi candles help smooth out price fluctuations, making it easier to identify trends and potential reversal points, which are crucial for making informed entry and exit decisions.
What should I do if the signals are conflicting?
If the signals from EMA, Supertrend, and candlesticks are conflicting, it’s advisable to wait for clearer alignment before entering a trade. Conflicting signals often indicate market indecision, which can lead to false entries and exits.
How can I use futures and options with this trading strategy?
You can apply this strategy by buying futures contracts or selling put options when a bullish signal is indicated, or by purchasing stocks or call options to capitalize on the expected price increase.
How can I learn more about EMA and Supertrend Indicators?
Upsurge.club offers a variety of courses on the EMA and Supertend Indicator, covering topics from basic concepts to advanced strategies. You can explore these courses here.
.