

How to use the Monthly 89-EMA Strategy scanner?
This scanner lists stocks that have already broken out or are on the verge of a long-term multi-period breakout. Stocks that make it to this scanner display a rise in momentum after being in a solid bearish trend for an extended period. An 89-period EMA is used as a basis for this scanner.
An exponential moving average (EMA) is a weighted average of the closing prices of the last few trading sessions, with a higher weight given to the most recent sessions. For example, a 30-period moving average shows the average price of the previous 30 trading sessions, where the weight given to the most recent sessions would be more than the weight given to older sessions. An EMA helps identify the trend.
An 89-period EMA has historically proven to give one a signal of a long-term trend reversal just in time. When the stock price has witnessed a solid bearish trend, and after that, the price starts consolidating near the 89-period EMA line, it is seen as a trend-reversing signal. Best suited for long-term positional trades, read on to determine how to implement this strategy.
We recommend using the following stock universe, indicators, and time frame for this strategy:
- Stock Universe: Nifty 500
- Indicators: Moving Average Ribbon (Use only 89-period high price and close price EMA)
- Time Frame: Monthly
Let’s learn how to enter and exit a trade with this strategy.
Entry
1. The scanner identifies stocks where the stock price is trading slightly below or above the 89-day EMA, i.e., very near the EMA line.
2. An entry is triggered once any bullish candlestick or a bullish candlestick pattern like a bullish marubozu or morning star is formed on or very near the EMA line.
3. Ideally, you should enter the stock at the end of the month, on the first bullish candle formed on 89-day EMA.
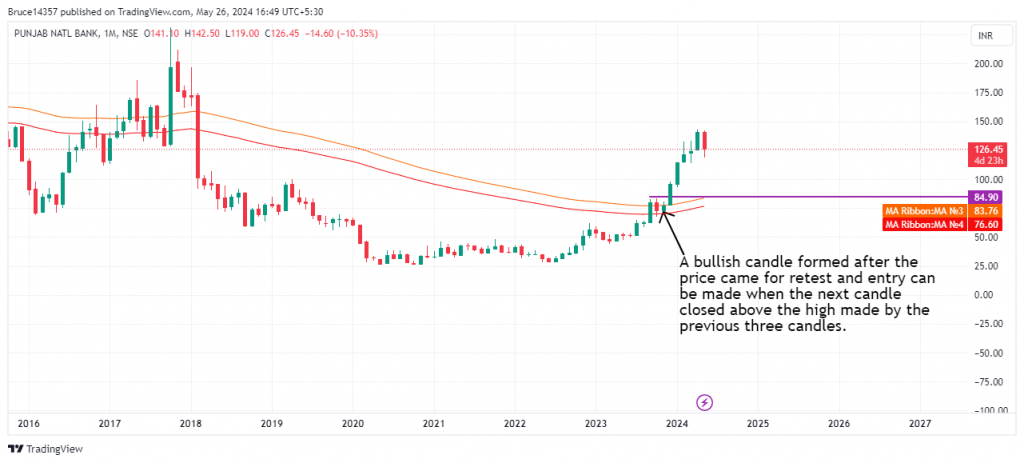
4. For a more risk-averse approach, consider entering the stock only when a bullish candle surpasses the high of the candle that triggered the entry.
The following chart marks the ideal entry point after a bullish signal on the 89-period EMA line occurs:
Stop Loss
The 89-period EMA close acts as a stop loss for this trade. If the price closes below the 89-period EMA, it is a clear sign to exit, indicating that long-term investors are losing interest, and the stock is losing momentum.
Exit
You can exit the trade in either of the following instances:
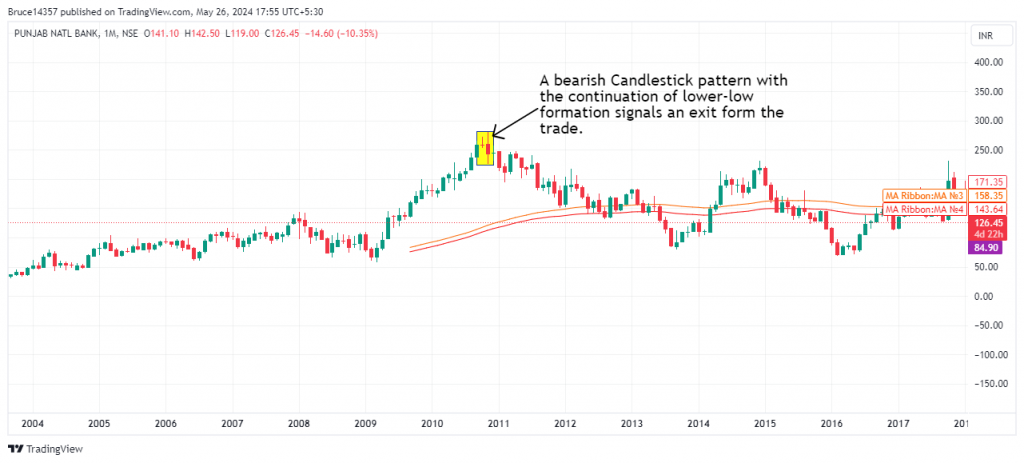
- The price makes a bearish candlestick pattern like an inverted hammer, bearish marubozu, or evening star, or forms a lower-low formation.
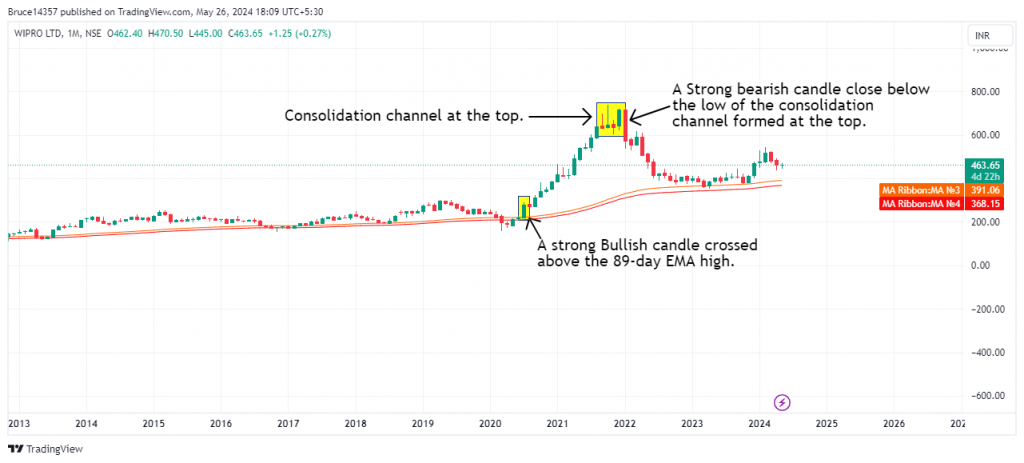
- The price consolidated at the top and a strong bearish candle was spotted below the consolidation channel.
Note: If your holding period is more than 5 years then you should follow only the 89-period EMA close as your exit signal.
The following chart marks a good exit point as per the strategy:
Example Trade
This strategy triggered an entry in Wipro Ltd. on 1st July 2020 when a strong bullish candle crossed above the 89-period EMA high, and an exit was marked by a strong bearish candle that closed below the low of the consolidation channel formed at the top of a rally on 03rd Jan 2022. The trade lasted 551 days, yielding a return of 163%.
Don’t forget
- This strategy is best suited to be used in the monthly time frame for the majority of the stocks.
- It is wise not to depend solely on this strategy for your entire portfolio.
- Above-average trading volumes on the day of entry and exit serve as strong confirmation signals.
Learn Momentum Trading with these courses

A-Z of Candlesticks Trading
by Kaushik Akiwatkar

Basics of Momentum Trading
by Khagesh Agarwal

Momentum Swing Trading
by Himanshu Arora
Frequently Asked Questions
Can I use this strategy with other EMAs?
The 89-period moving average acts as a crucial support for most stocks. For some stocks, however, 50-period or 200-period EMAs are more helpful. A trial-and-error method is required to know the most helpful EMA for each stock
How can I learn more about momentum trading?
You can learn momentum trading from experienced traders and highly rated instructors at Upsurge.club. We would highly recommend Himanshu Arora’s Momentum Swing Trading course on Upsurge.club, which will teach you a swing trading strategy especially for mid and small cap stocks.