

How to use the Moving Average Scalping Strategy (Bearish) scanner?
This scanner lists stocks suitable for scalping trading, i.e., trades within seconds or minutes. It filters out stocks on criteria such as the 9-period EMA crossing below the 9-period SMA with the 28-period RSI below 35.
Let’s learn about the indicators used in this scanner.
Exponential moving average (EMA)
It is a weighted average of the closing prices of the last few trading sessions, with a higher weight given to the most recent sessions. For example, a 30-day moving average shows the average price of the last 30 trading sessions, where the weight given to the most recent sessions would be more than the weight given to older sessions. An EMA helps identify the trend.
Relative Strength Index (RSI)
It is a momentum oscillator traders use to measure the speed and change of price movements. It ranges from 0 to 100, with values above 70 indicating overbought conditions and below 30 indicating oversold conditions. The RSI helps identify potential buy or sell signals and trend reversals based on market momentum.
This strategy is designed explicitly for scalpers. It’s particularly effective in indicating when a stock is gaining short-term momentum, enabling traders to capture the move within seconds or minutes.
To implement this strategy, we recommend using the following stock universe, indicators, and time frame:
- Stock Universe: Nifty 200
- Indicators: SMA, EMA & RSI
- Time Frame: 5-minute
Let’s learn how to enter & exit a trade with this strategy.
Entry
1. Wait for the 9-period EMA to cross below the 9-period SMA.
2. The RSI should be below 35.
3. Enter the stock if the above conditions are fulfilled.
4. For a more risk-averse approach, consider entering the stock only when the bearish candle surpasses the low of the previous candle.
5. Spotting a bullish candlestick pattern like a bearish marubozu or evening star provides strong confirmation for entering the trade.
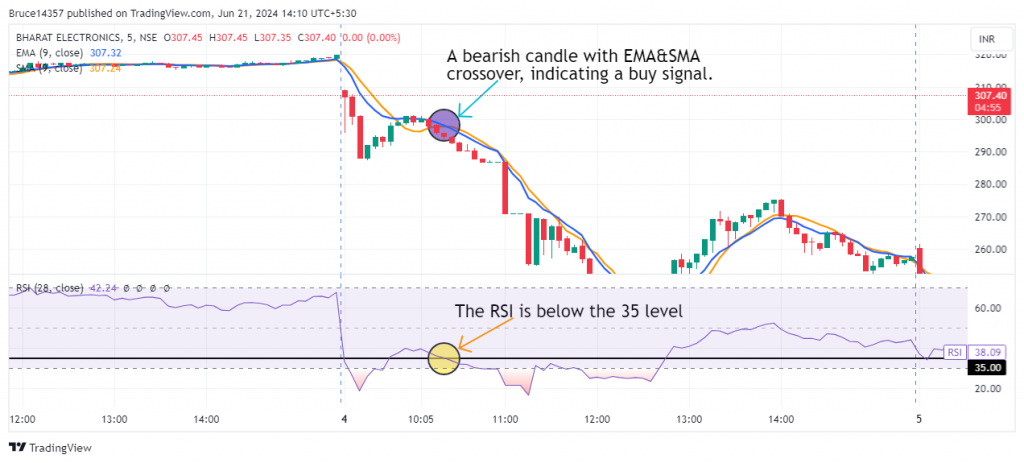
The following chart marks the ideal entry point for bullish trade in the Moving Average Scalping Strategy (Bearish):
Stop Loss
The SMA can act as a stop loss for the trade, signaling that the price is losing momentum.
Exit
You can exit the trade in either of the following instances:
1. The price reaches its latest swing low or previously tested support level.
2. The sequence of lower highs and lower lows is ended.
3. Spotting a bearish candlestick pattern like a bullish marubozu, or morning star along with either of the above conditions provides strong confirmation for exiting the trade.
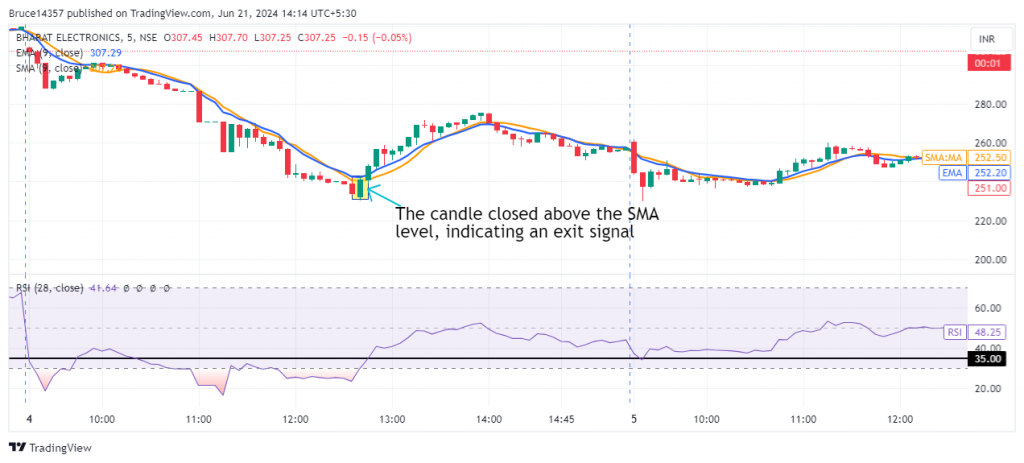
The following chart marks good exit points after the Moving Average Scalping Strategy (Bearish):
Example Trade
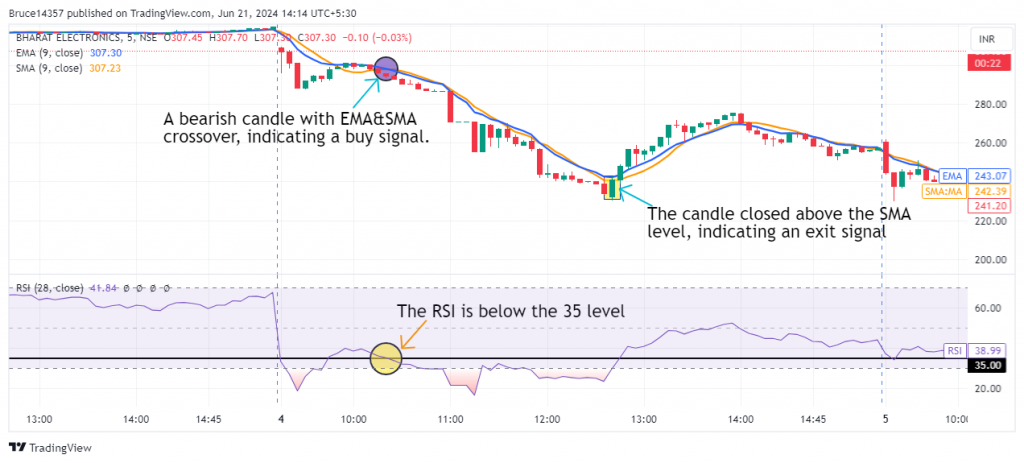
This strategy triggered an entry in Bharat Electronics Ltd. Ltd. on 04th June 2024 when the RSI was below the 35 level and a bearish candle with EMA&SMA crossover. An exit was marked when the prices closed above the SMA on 04th June 2024. The trade lasted 140 minutes, yielding a return of 18%.
Don’t forget
- This strategy works well in the 1-minute, 2-minute, and 3-minute timeframes as well. Finding the optimal time frame involves a trial-and-error approach and necessitates thorough backtesting.
- It is wise not to depend solely on this strategy for your entire portfolio.
- Give preference to a fresh crossover over just the existence of the EMA being above the SMA.
Learn scalping with these courses

Intraday Trading Strategies
by Jyoti Budhia

Options Scalping Strategies
by Himanshu Arora

Scalping in Futures
by Mukta Dhamankar
Frequently Asked Questions
What are common mistakes to avoid in the bearish strategy?
Avoid taking trades based solely on the RSI without confirmation from the EMA or other indicators. Also, be cautious of low-volume periods, which can lead to false signals.
Can I combine this strategy with other indicators?
Yes, combining RSI and EMA with other indicators such as MACD, Bollinger Bands, or volume analysis can enhance signal accuracy and offer a more comprehensive market perspective. However, it is crucial to backtest and adjust the strategy parameters according to the specific asset and time frame.
How can I use futures and options with this trading strategy?
You can apply this strategy by selling futures contracts or selling call options when a bearish signal is indicated or by purchasing put options to capitalize on the expected price decrease.
How can I learn more about RSI and EMA Indicators?
Upsurge.club offers a variety of courses on the RSI and EMA Indicator, covering topics from basic concepts to advanced strategies. You can explore these courses here.
.