
How to use the Pivots + Supertrend scanner?
This scanner identifies stocks entering a strong bull phase as per the Pivot points and Supertrend indicators.
Let’s learn about the indicators used in this scanner.
Supertrend
It identifies trends and potential reversal points. It is plotted on the price chart, giving out buy and sell signals based on price action and volatility. It determines trend direction, and entry & exit points and helps enhance a trading strategy’s accuracy and efficiency.
Exponential moving average (EMA)
It is a weighted average of the closing prices of the last few trading sessions, with a higher weight given to the most recent sessions. For example, a 30-day moving average shows the average price of the previous 30 trading sessions, where the weight given to the most recent sessions would be more than the weight given to older sessions.
Pivot Points
It is used to identify potential support and resistance levels in the market. It calculates key price levels based on the previous day’s high, low, and close. You can use these levels—Pivot Point, Resistance (R1, R2), and Support (S1, S2)—to predict potential price movement and make informed trading decisions.
This strategy, a powerful combination of the Supertrend and Pivot Points indicators, is designed explicitly for swing traders. It’s particularly effective in indicating when a stock is gaining short-term momentum, enabling traders to capture the move over a few days or weeks.
To implement this strategy, we recommend using the following stock universe, indicators, and time frame:
- Stock Universe: Nifty 50
- Indicators: Pivot Points, Supertrend, EMA
- Time Frame: Daily
Let’s learn how to enter & exit a trade with this strategy.
Entry
You can take a trade when all the below conditions are met:
1) The stock is trading above the Supertrend level, i.e. the Supertrend in bullish.
2) The closing price should be above the 200-day EMA line.
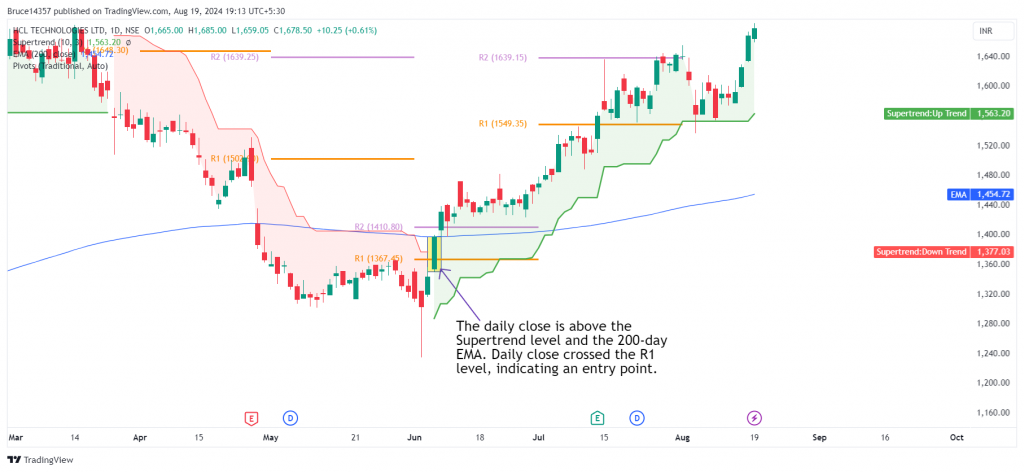
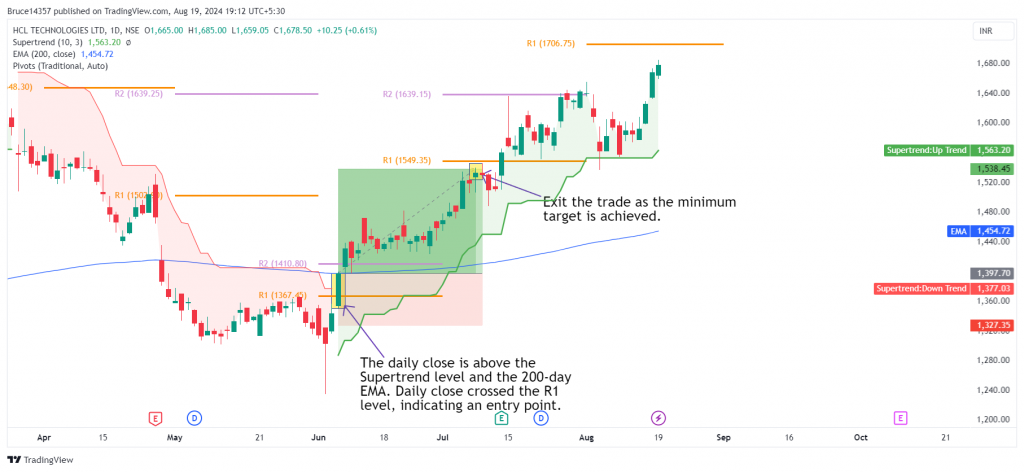
3) Take an entry when the daily candle closes above the R1(Resistance) level.
For a more risk-averse approach, consider entering the stock only when the bullish candle surpasses the high of the previous candle. Spotting a bullish candlestick pattern like a bullish marubozu or morning star provides strong confirmation for entering the trade.
The following chart marks the ideal entry points after the conditions of the strategy have been met:
Stop Loss
A 5% drop from the entry point will trigger a stop loss.
Exit
You can exit the trade in either of the following instances:
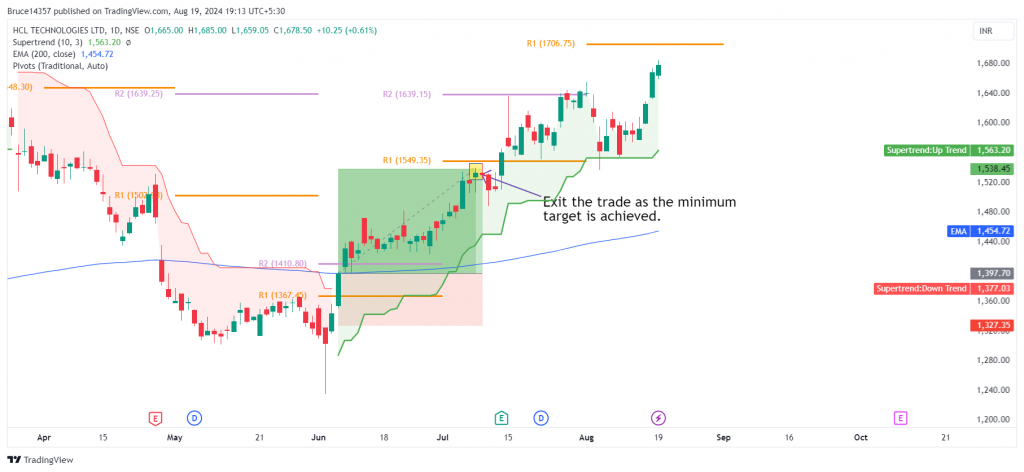
1) A minimum target can be the 10% upside from the entry point.
2) Exit the trade if the stock goes 5% below the entry point.
3) Stock goes below the Supertrend level.
4). Stock goes below the 200-day EMA line.
Spotting a bearish candlestick pattern like a bearish marubozu, or evening star along with either of the above conditions provides strong confirmation for exiting the trade.
The following chart marks multiple decent exit points as per the strategy:
Example Trade
This strategy triggered an entry in HCL Tech Ltd. on 6th June 2024 when prices were above the 200-day EMA line & the Supertrend level and the daily close crossed the R1 level. An exit was marked when the minimum target of 10% was achieved on 8th July 2024. The trade lasted 33 days, yielding a return of 10%.
Don’t forget
- This strategy is best suited to be used in the daily time frame for most stocks. However, for some stocks, a weekly or monthly time frame may produce better results. Finding the optimal time frame involves a trial-and-error approach and necessitates thorough backtesting.
- It is wise not to depend solely on this strategy for your entire portfolio.
- Above-average trading volumes on the day of entry and exit serve as strong confirmation signals.
Learn swing trading with these courses

Momentum Swing Trading
by Himanshu Arora

Price Action using CPR
by Gomathi Shankar

Basics of Momentum Trading
by Khagesh Agarwal
Frequently Asked Questions
Shall I trade in all the stocks listed in this scanner?
No! This scanner is just a first-level filter to get a list of stocks that are showing good momentum as per the indicators mentioned. Further analysis is recommended before initiating a trade.
How can I learn more about momentum trading?
You can learn momentum trading from experienced traders and highly rated instructors at Upsurge.club. We would highly recommend Himanshu Arora’s Momentum Swing Trading course on Upsurge.club, which will teach you a swing trading strategy especially for mid and small cap stocks.