

How to use the Pre-Breakout Swing scanner?
This scanner identifies swing trading opportunities by shortlisting stocks that are about to breakout soon. You can either enter these stocks directly after analysis or wait for a pullback to plan your trade.
Let’s learn about the indicators used in this scanner.
Exponential moving average (EMA)
It is a weighted average of the closing prices of the last few trading sessions, with a higher weight given to the most recent sessions. For example, a 30-day moving average shows the average price of the last 30 trading sessions, where the weight given to the most recent sessions would be more than the weight given to older sessions. The triple EMA’s crossover helps in the clear identification of trends and reduces false signals.
This strategy is designed explicitly for swing and positional traders. It’s particularly effective in indicating when a stock is gaining short-term momentum, enabling traders to capture the move over a few weeks or months.
To implement this strategy, we recommend using the following stock universe, indicators, and time frame:
- Stock Universe: Nifty 500
- Indicators: EMA
- Time Frame: Daily
Let’s learn how to enter & exit a trade with this strategy.
Entry
You can take a trade when all the below conditions are met:
1) The high in the past 8 weeks should be greater than or equal to the 52-week high.
2) The daily close should not be trading more than 5% above the 50-day EMA line.
3) The daily close should be greater than the 200-day EMA line.
4) The 20-day EMA line should be above the 50-day EMA line and the 50-day EMA line should be above the 200-day EMA line.
You can add these stocks to your watchlist and plan your trade after a pullback in the trend.
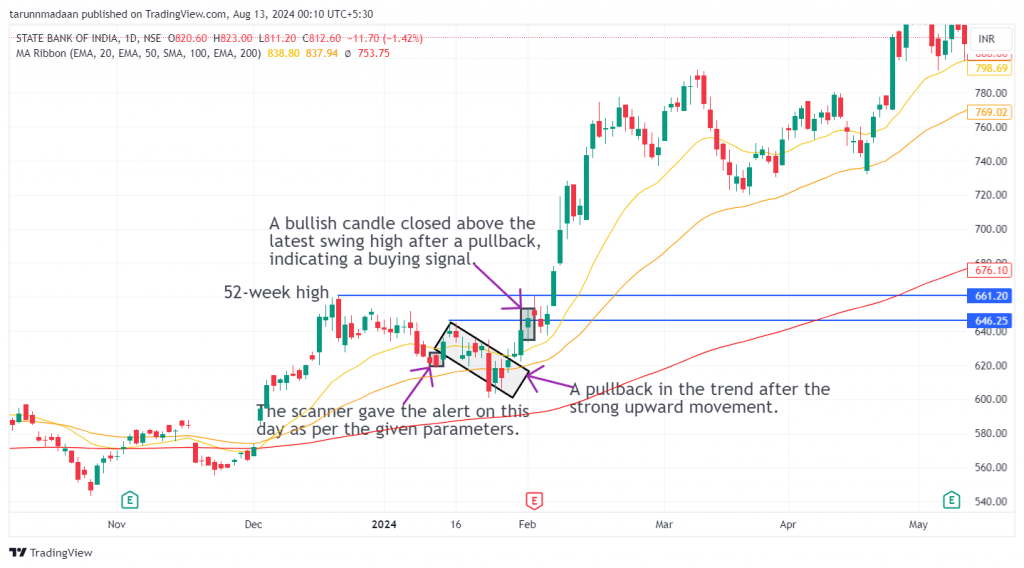
For a more risk-averse approach, consider entering the stock only when the bullish candle surpasses the high of the previous candle. Spotting a bullish candlestick pattern like a bullish marubozu or morning star provides strong confirmation for entering the trade.
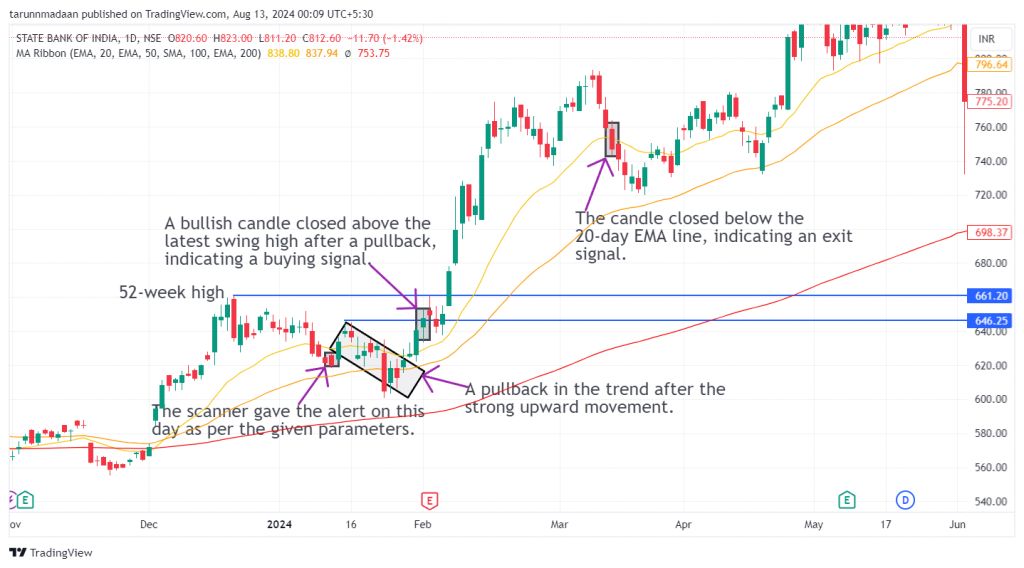
The following chart marks the ideal entry points after the conditions of the strategy have been met:
Stop Loss
The recent swing low of the pullback acts as a clear sign to exit, indicating that short-term traders are losing momentum.
Exit
You can exit the trade in either of the following instances:
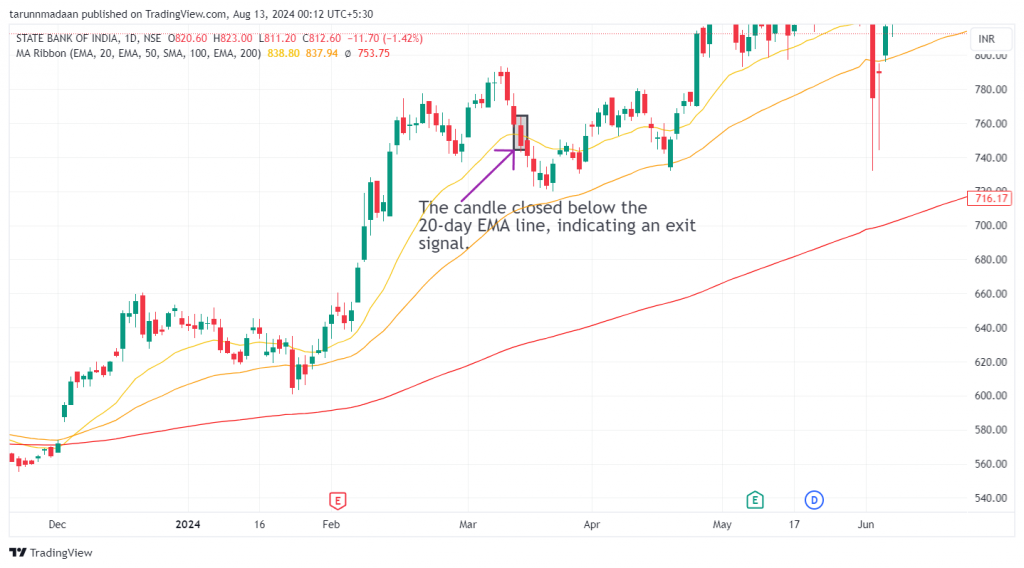
1) The daily candle closes below the 20-day EMA line.
2) The 20-day EMA line goes below the 50-day EMA line.
3) Lower-low pattern formations after the all-time high is reached.
Spotting a bearish candlestick pattern like a bearish marubozu, or evening star along with either of the above conditions provides strong confirmation for exiting the trade.
The following chart marks multiple decent exit points as per the strategy:
Example Trade
The scanner gave an alert on the stock on 11th Jan 2024 but the strategy triggered an entry in SBIN Ltd. on 1st Feb 2024 when prices were closed above the latest swing high after a small pullback. An exit was marked when the stock price closed below the 20-day EMA line on 13th March 2024. The trade lasted 41 days, yielding a return of 13.65%.
Don’t forget
- This strategy is best suited to be used in the daily time frame for most stocks. However, for some stocks, a weekly or monthly time frame may produce better results. Finding the optimal time frame involves a trial-and-error approach and necessitates thorough backtesting.
- It is wise not to depend solely on this strategy for your entire portfolio.
- Executing trades at the end of the trading session helps reduce the risk of false signals.
- Above-average trading volumes on the day of entry and exit serve as strong confirmation signals.
Learn Swing and positional trading with these courses

Learn Technical Analysis in Hindi
by Jyoti Budhia

Swing Trading and Scalping Strategies
by Super Trader Lakshya

Momentum Swing Trading Strategy
by Himanshu Arora
Frequently Asked Questions
Why is the 52-week high an important factor in this strategy?
The 52-week high is a key resistance level, and when a stock is trading close to or above this level, it indicates strong momentum and the potential for a breakout. Stocks that meet this criterion are likely to continue their upward trend, making them good candidates for swing trades.
How does the triple EMA crossover work in this strategy?
The triple EMA crossover involves the 20-day, 50-day, and 200-day EMAs. When the 20-day EMA is above the 50-day EMA, and the 50-day EMA is above the 200-day EMA, it indicates a strong uptrend, reducing the likelihood of false signals and confirming the stock’s bullish momentum.
How does the pullback play a role in planning the trade?
A pullback is a temporary reversal in the trend, providing a better entry point for the trade. Waiting for a pullback after the initial breakout reduces the risk of entering at a peak and increases the likelihood of capturing the next upward move.
How can I use futures and options with this trading strategy?
You can apply this strategy by buying futures contracts or selling put options when a bullish signal is indicated, or by purchasing stocks or call options to capitalize on the expected price increase.
How can I learn more about EMA Indicator?
Upsurge.club offers a variety of courses on the EMA Indicator, covering topics from basic concepts to advanced strategies. You can explore these courses here.
.