

How to use the RSI + Supertrend Momentum scanner?
This scanner lists stocks that are entering an effective bull phase according to the principles of technical analysis. It filters out stocks in which the daily closing price exceeds the Supertrend and where the stock’s RSI has crossed above the level of 50.
In Jyoti Budhia’s renowned technical analysis course, you’ll dive deep into a variety of indicators and trading strategies, all illustrated with practical examples.
To implement this strategy, we recommend using the following stock universe, indicators, and time frame:
- Stock Universe: Nifty 500
- Indicators: Relative Strength Index (RSI), Supertrend
- Time Frame: Daily
Let’s learn how to enter & exit a trade with this strategy.
Entry
- The scanner identifies stocks when the daily close is greater than the Supertrend and the RSI has crossed above 50.
- An entry is triggered when once both indicators confirm a buy signal.
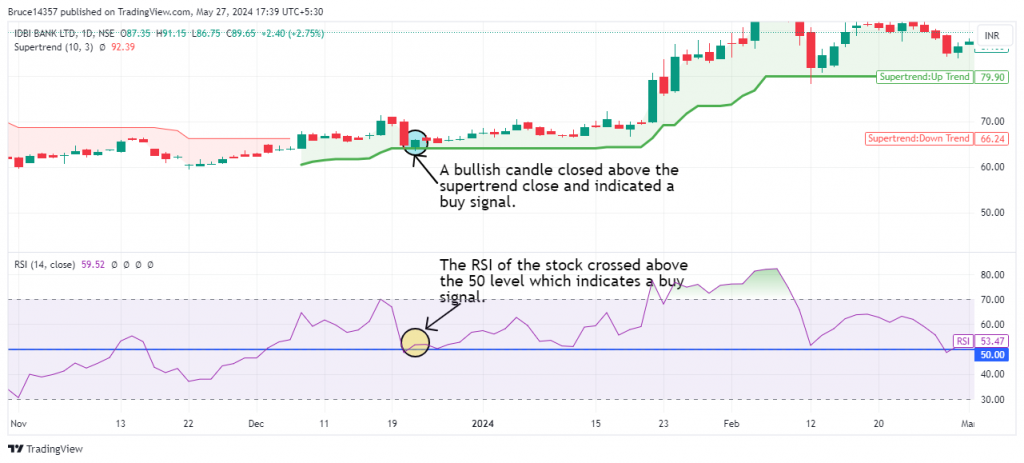
- Ideally, you should enter the stock at the end of the day, on the first bullish candle after the buy signals in both the indicators.
- For a more risk-averse approach, consider entering the stock only when a bullish candle surpasses the high of the candle that triggered the entry.
- Spotting a bullish candlestick pattern like a bullish marubozu or morning star provides strong confirmation for entering the trade.
The following chart marks the ideal entry point after an RSI+Supertrend signal occurs:
Stop Loss
The price closing below the Supertrend level acts as a clear sign to exit the trade, signalling that the price is losing momentum.
Exit
You can exit the trade in either of the following instances:
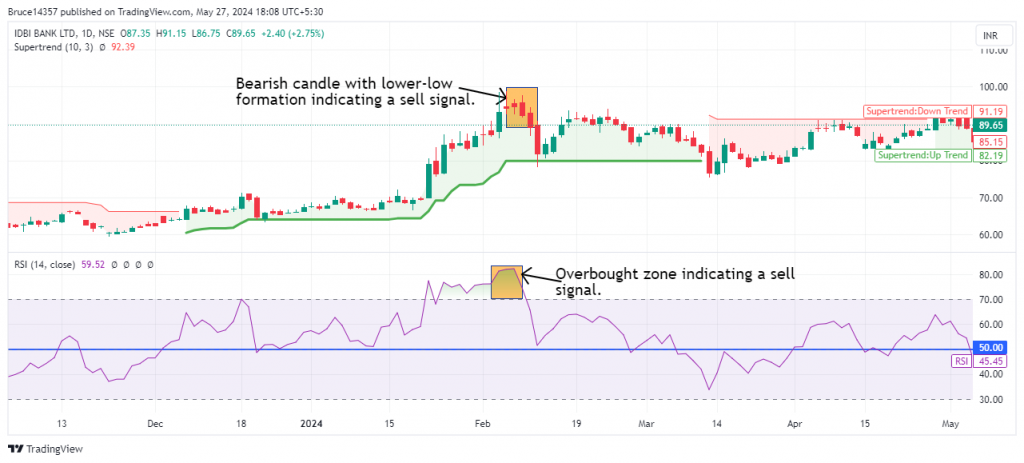
- The price reaches its latest swing high or previously tested resistance level or forms a lower-low pattern.
- The RSI reaches its overbought range (>70).
- The price closes below the Supertrend level.
- Spotting a bearish candlestick pattern like a bearish marubozu or evening star along with either of the above conditions provides strong confirmation for exiting the trade. The following chart marks multiple good exit points RSI+Supertrennd Bullish signal:
Example Trade
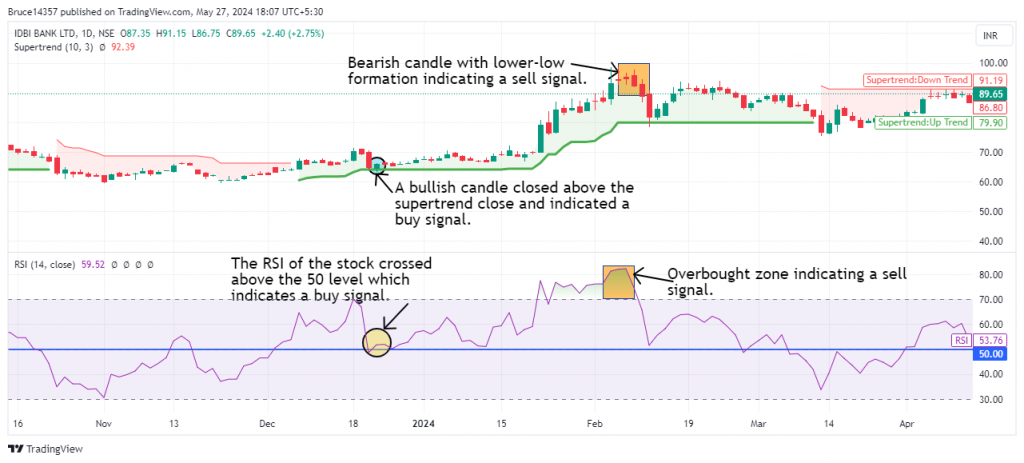
This strategy triggered an entry in IDBI Bank on 21st Dec 2023 when an entry was trigerred according to the strategy, and an exit was clear as seen by bearish candles in lower-low formation at the top and RSI was in the overbought zone on 8th Feb 2024. The trade lasted 49 days, yielding a return of 40%.
Don’t forget
- This strategy is best suited to be used in the daily time frame for most stocks. However, for some stocks, a weekly or monthly time frame may produce better results. Finding the optimal time frame involves a trial-and-error approach and necessitates thorough backtesting.
- It is wise not to depend solely on this strategy for your entire portfolio.
- Above-average trading volumes on the day of entry and exit serve as strong confirmation signals.
Learn momentum trading with these courses

Technical Analysis in Hindi
by Jyoti Budhia

Basics of Momentum Trading
by Khagesh Agarwal

Supertrend Indicator Strategy
by Khagesh Agarwal
Frequently Asked Questions
What is RSI?
The Relative Strength Index (RSI) is a momentum oscillator traders use to measure the speed and change of price movements. It ranges from 0 to 100, with values above 70 indicating overbought conditions and below 30 indicating oversold conditions. The RSI helps identify potential buy or sell signals and trend reversals based on market momentum.
What is Supertrend?
The Supertrend indicator identifies trends and potential reversal points. It is plotted on the price chart, giving out buy and sell signals based on price action and volatility. It determines trend direction, and entry & exit points and helps enhance a trading strategy’s accuracy and efficiency.
What is momentum trading?
Momentum trading is a strategy that capitalizes on the continuation of existing trends in the market. Traders buy assets experiencing upward trends and sell those in downward trends, aiming to profit from the momentum.
Where can I learn momentum trading?
| To learn more about momentum trading, explore the following courses on Upsurge: |
| Momentum trading in options |
| Basics of momentum trading |
| Momentum swing trading strategy |
Where can I learn more about Supertrend indicator?
To learn more about Supertrend indicator, explore the Supertrend Indicator Strategy course on Upsurge.club. It covers a range of trading strategies using the Supertrend indicator.