How to use the Stochastic RSI+EMA scanner?
This scanner filters out stocks with potential upward momentum based on signals from the stochastic RSI and EMA indicators.
Let’s learn about the indicators used in this scanner.
Exponential moving average (EMA)
is a weighted average of the closing prices of the last few trading sessions, with a higher weight given to the most recent sessions. For example, a 30-day moving average shows the average price of the last 30 trading sessions, where the weight given to the most recent sessions would be more than the weight given to older sessions.
Stochastic RSI
It combines the Stochastic Oscillator and Relative Strength Index (RSI) where the oscillator’s values are calculated using the RSI instead of the price of the stock. A stochastic oscillator helps determine trends and predict reversals. This oscillator is made up of two lines – the K%, which reflects the actual value of the oscillator, and the D%, which is a 3-day moving average of K%. When the slow stochastic K% crosses above D%, it indicates bullish momentum strengthening, potentially signaling a buy signal as it suggests the current price is rising faster than the average over recent periods.
This strategy is designed explicitly for swing and positional traders. It’s particularly effective in indicating when a stock is gaining short-term momentum, enabling traders to capture the move over a few weeks or months.
To implement this strategy, we recommend using the following stock universe, indicators, and time frame:
- Stock Universe: Market Cap > 1000 crores
- Indicators: Stochastic RSI, EMA
- Time Frame: Daily
Let’s learn how to enter & exit a trade with this strategy.
Entry
You can take a trade when all the below conditions are met:
1) Wait for the smoothened lines of the stochastic RSI to appear below 20.
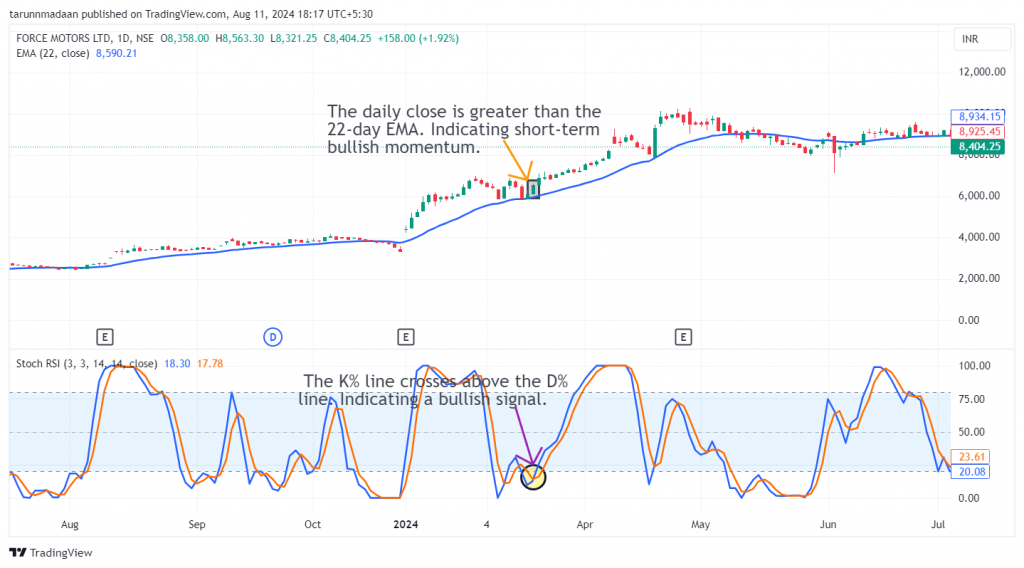
2) An entry/long trade is triggered when the K% line crosses above the D% line.
3) Make sure that the daily close is greater than the 22-day EMA.
For a more risk-averse approach, consider entering the stock only when the bullish candle surpasses the high of the previous candle. Spotting a bullish candlestick pattern like a bullish marubozu or morning star provides strong confirmation for entering the trade.
The following chart marks the ideal entry points after the conditions of the strategy have been met:
Stop Loss
The price closing below the 22-day EMA line acts as a clear sign to exit the trade, signaling that the price is losing momentum.
Exit
You can exit the trade in either of the following instances:
1) Wait for the smoothened lines of the stochastic RSI to appear above 80.
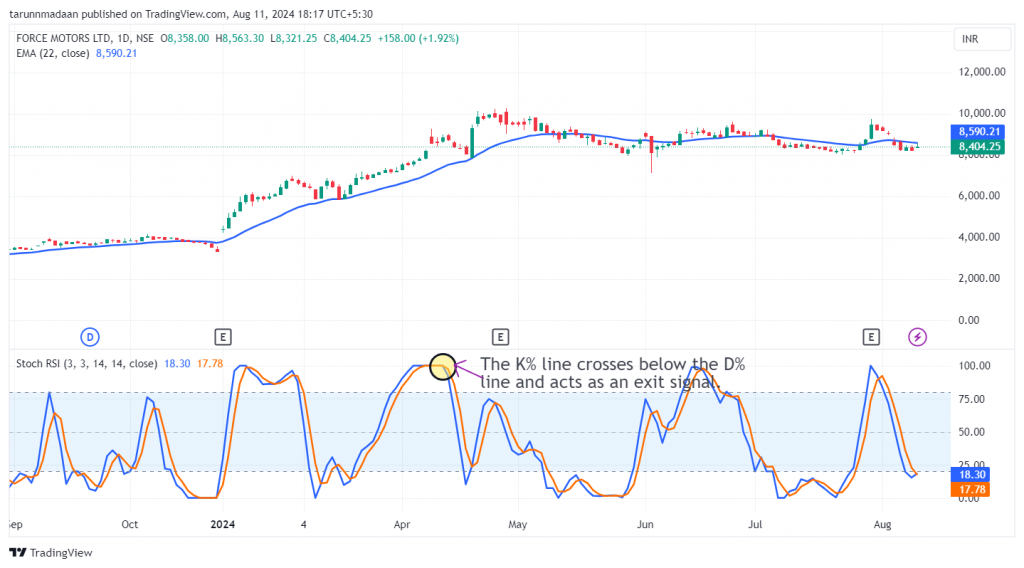
2) An exit/short trade is triggered when the K% line crosses below the D% line.
3) Make sure that the daily close is less than the 22-day EMA.
Spotting a bearish candlestick pattern like a bearish marubozu, or evening star along with either of the above conditions provides strong confirmation for exiting the trade.
The following chart marks multiple decent exit points as per the strategy:
Example Trade
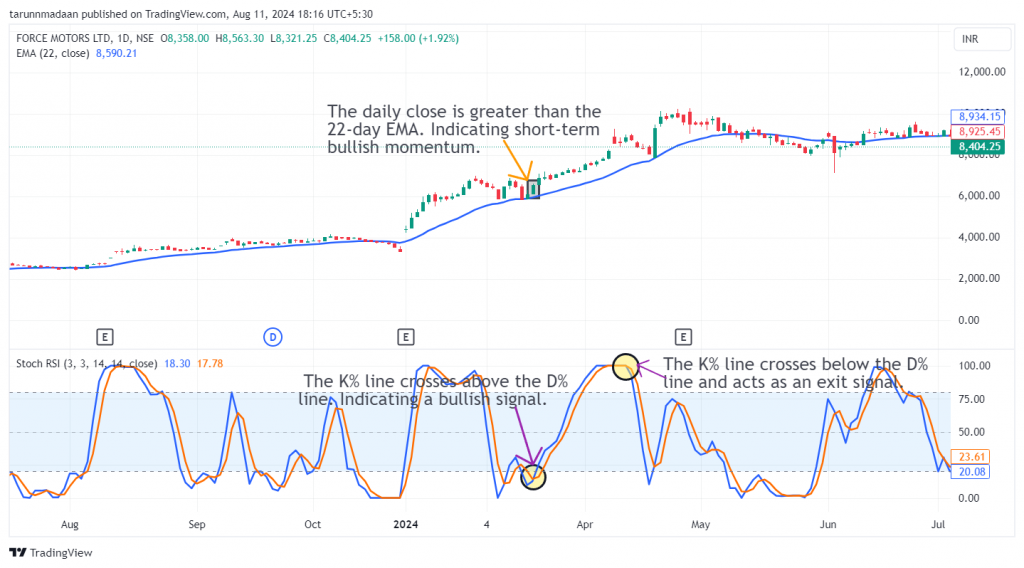
This strategy triggered an entry in Force Motors Ltd. on 15th March 2024 when prices were above the 22-day EMA line and the K% line was crossed above the D% line, giving a buy signal. An exit was marked when the K% line crossed below the D% line on 10th April 2024. The trade lasted 26 days, yielding a return of 35.6%.
Don’t forget
- This strategy is best suited to be used in the daily time frame for most stocks. However, for some stocks, a weekly or monthly time frame may produce better results. Finding the optimal time frame involves a trial-and-error approach and necessitates thorough backtesting.
- It is wise not to depend solely on this strategy for your entire portfolio.
- Above-average trading volumes on the day of entry and exit serve as strong confirmation signals.
Learn Swing and Positional trading with these courses

Momentum Trading with RSI
by Bharat Jhunjhunwala

Momentum Swing Trading Strategy
by Himanshu Arora

Swing Trading and Scalping Strategies
by Super Trader Lakshya
Frequently Asked Questions
Is this strategy suitable for all market conditions?
This strategy is most effective in trending markets where clear momentum can be identified. In choppy or sideways markets, the signals may become less reliable, leading to false entries and exits. It’s important to be mindful of overall market conditions when using this strategy.
What should I do if the market is experiencing high volatility?
In periods of high volatility, signals from the Stochastic RSI and EMA may become less reliable due to frequent price swings. During such times, it might be helpful to use a longer time frame (e.g., weekly charts) to reduce noise or to wait for additional confirmation from other indicators before entering a trade.
How can I use futures and options with this trading strategy?
You can apply this strategy by buying futures contracts or selling put options when a bullish signal is indicated, or by purchasing stocks or call options to capitalize on the expected price increase.
How can I learn more about Stochastic RSI and Ichimoku Cloud Indicators?
Upsurge.club offers a variety of courses on the Stochastic RSI and EMA Indicator, covering topics from basic concepts to advanced strategies. You can explore these courses here.
.