

How to use the Volume Breakout (Large-cap) scanner?
This scanner lists large-cap stocks experiencing above-average volumes, indicating market momentum, both bullish and bearish. It filters out stocks fulfilling any of the below conditions:
- When daily volumes of the stock are greater than 1.25 times the 5-period average.
- When daily volumes of the stock are greater than 1.5 times the 21-period average.
- When weekly volumes of the stock are greater than 2.0 times the 12-period average.
Trading Volume
It refers to the total number of shares or contracts traded for a security during a given period. The volume is used to gauge the strength of price movement; higher volume often indicates stronger, more reliable trends, while lower volume can suggest weaker trends or potential reversals. It helps in confirming price movements and market sentiment.
Moving average of volume
It indicates the average trading volume over a specific period, smoothening out short-term fluctuations. It helps identify trends in trading activity, such as increasing or decreasing interest in a security. A rising volume moving average can signal growing market interest, while a declining average may signal waning interest or consolidation periods.
This scanner is designed explicitly for swing and positional traders. It’s particularly effective when a stock gains short-term momentum, enabling traders to capture the move over a few days or weeks at the right time.
To implement this strategy, we recommend using the following stock universe, indicators, and time frame:
- Stock Universe: Nifty 100
- Indicators: Volume Indicator (including volume moving average)
- Time Frame: Daily, Weekly
Example Trade
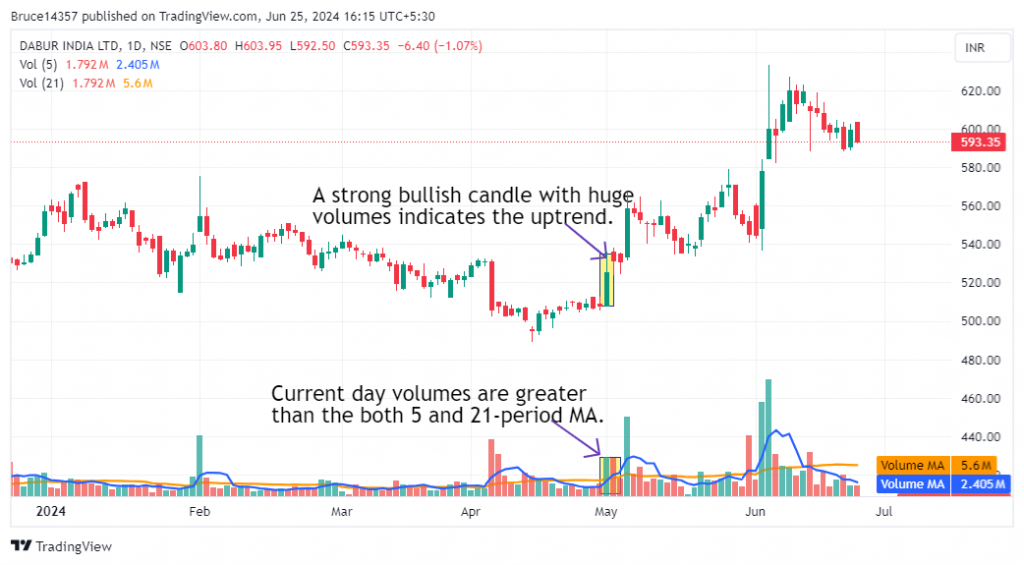
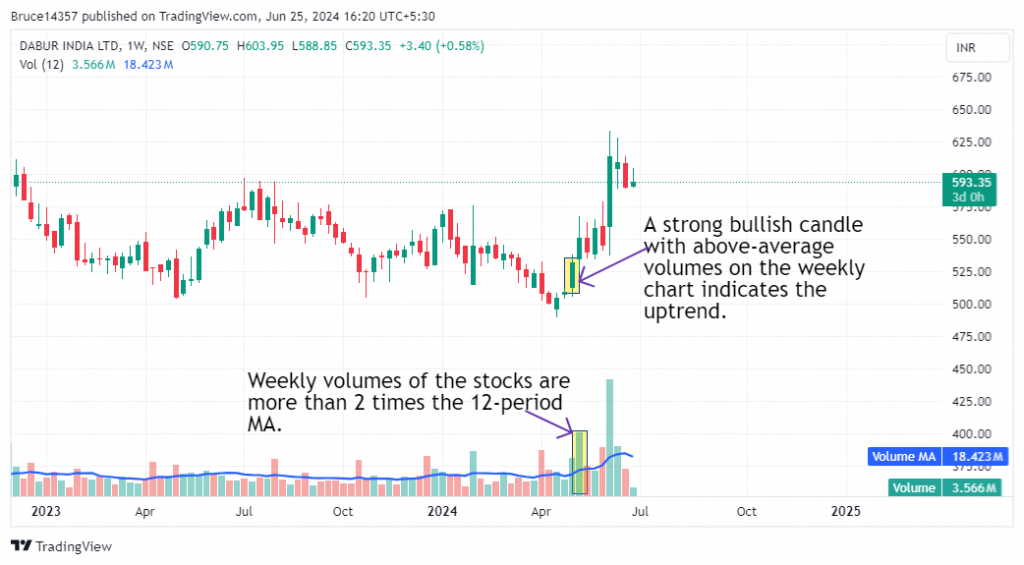
This strategy triggered an entry in Dabur India Ltd. on 02nd May 2024 when the daily volumes were greater than the both 5 and 21-period moving average of volume, indicating short-term momentum. On the weekly chart also the volumes are greater than 2 times the 12-period moving average.
Don’t forget
- This strategy is best suited to be used in the daily and weekly time frame for most stocks. Finding the optimal time frame involves a trial-and-error approach and necessitates thorough backtesting.
- It is wise to combine this strategy with other trading strategies and use this scanner just as a starting watchlist.
- Using trendlines, support, resistance, and indicators along with this strategy gives you a better understanding of the trend.
Learn momentum Trading with these courses

Technical Analysis in Hindi
by Jyoti Budhia

Basics of Momentum Trading
by Khagesh Agarwal

Momentum Swing Trading
by Himanshu Arora
Frequently Asked Questions
Can I use volume analysis for every strategy?
Yes, the volume indicator can enhance any trading strategy by confirming price trends, identifying reversals, and validating breakouts, helping traders make more informed decisions based on market activity.
Will these conditions work on mid cap and small cap stocks as well?
This scanner is made to highlight large cap volume breakout stocks specifically, keeping in mind their typical volatility and price movement. For mid cap and small cap stocks, you can check out this scanner.
How can I learn more about momentum trading?
You can learn momentum trading from experienced traders and highly rated instructors at Upsurge.club. We would highly recommend Himanshu Arora’s Momentum Swing Trading course on Upsurge.club, which will teach you a swing trading strategy especially for large cap stocks.